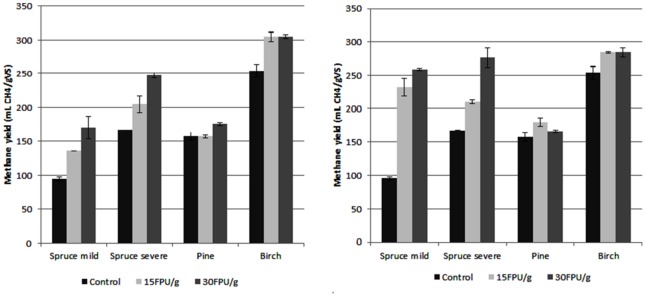
FIGURE 6.

Effect of enzymatic treatment on the methane yields, when it took place prior to (A) and along with (B) the digestion. The first bar represents the control without addition of enzyme, and the second and third bars the addition of enzyme at 15 FPU/g and 30 FPU/g load, respectively.
