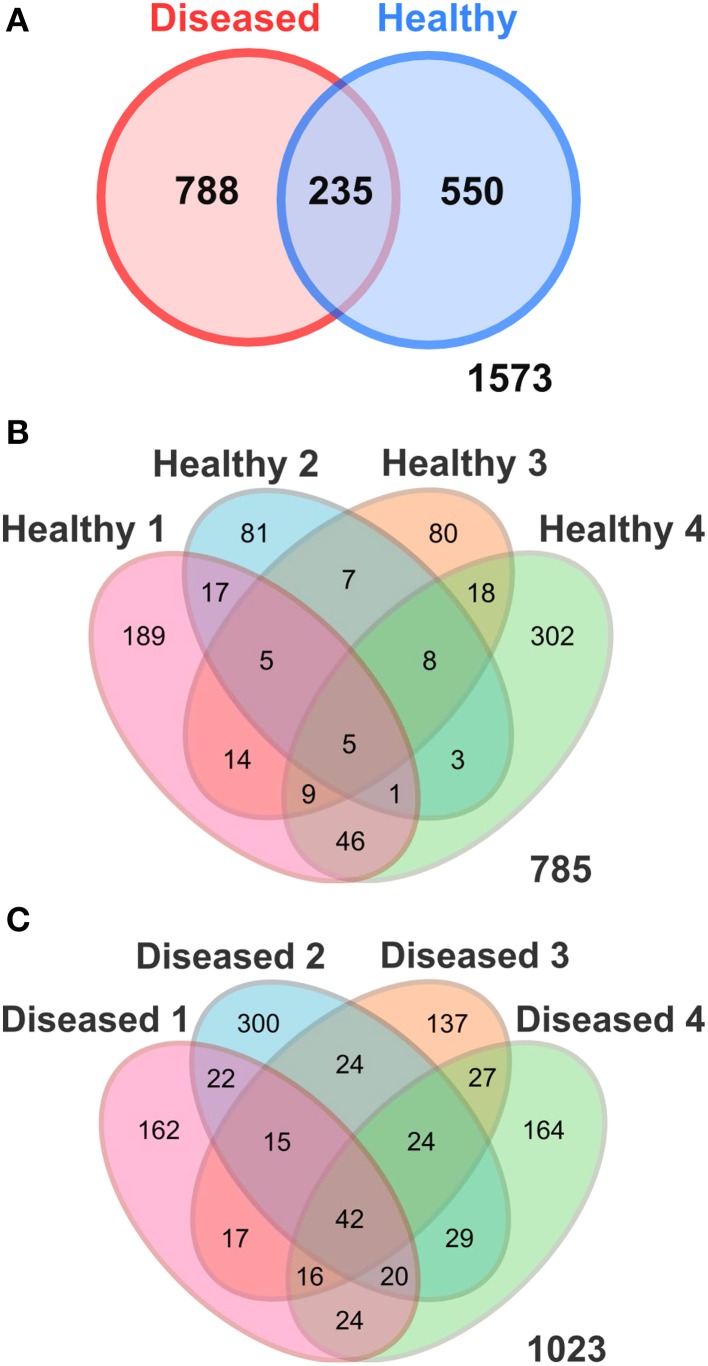
Figure 2.
Venn Diagrams illustrating the number of shared OTUs (97% sequence similarity) (A) between the apparently healthy and diseased P. carnosus tissues; and among the replicates of (B) the apparently healthy and (C) the diseased tissues detected in P. carnosus by pyrosequencing. Healthy, apparently healthy tissues of SGA affected P. carnosus colonies; Diseased, diseased tissues of SGA affected colonies.

