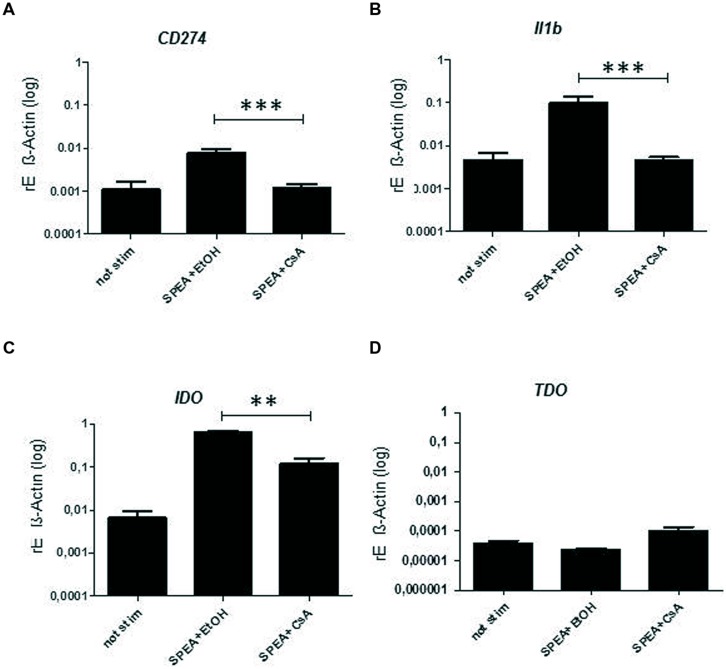
FIGURE 7.
Cyclosporine A – mediated expression of mRNA. CD14+ monocytes were stimulated 24 h with SPEA (100 ng/ml) and CsA (1 μM) or Ethanol (equal volume to CsA). Quantitative real-time PCR of cDNA was performed with sequence-specific primers for (A) CD274, (B) Il1b, (C) IDO, (D) TDO. Data were normalized to ß-Actin. Shown is the mean and standard deviation of 5 donors. Statistical analysis was performed using a Multiple Comparison of Means (Tukey Contrasts). Significance codes: 0 ‘∗∗∗’; 0.001 ‘∗∗’; 0.01 ‘∗’.

