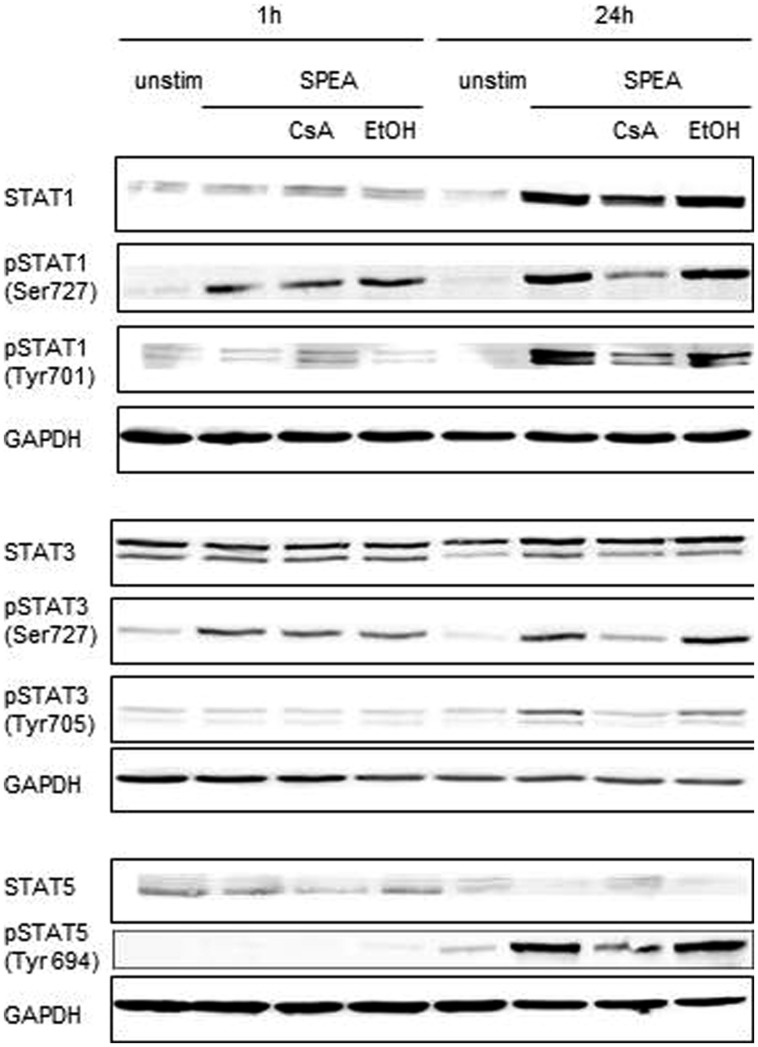
FIGURE 9.
STAT activation after SPEA stimulation. (A) CD14+ monocytes were stimulated for 1 or 24 h with 100 ng/ml SPEA and 1 μM CsA (Ethanol was used equal to the amount of CsA). Cells were lysed and analyzed by western blotting with specific antibodies against STAT1, phospho-STAT1 (Ser727, Tyr701), STAT3, phospho-STAT3 (Ser727, Tyr 705), STAT5 and phospho-STAT5 (Tyr 694). GAPDH as loading control was displayed. Shown is one representative experiment out of three.

