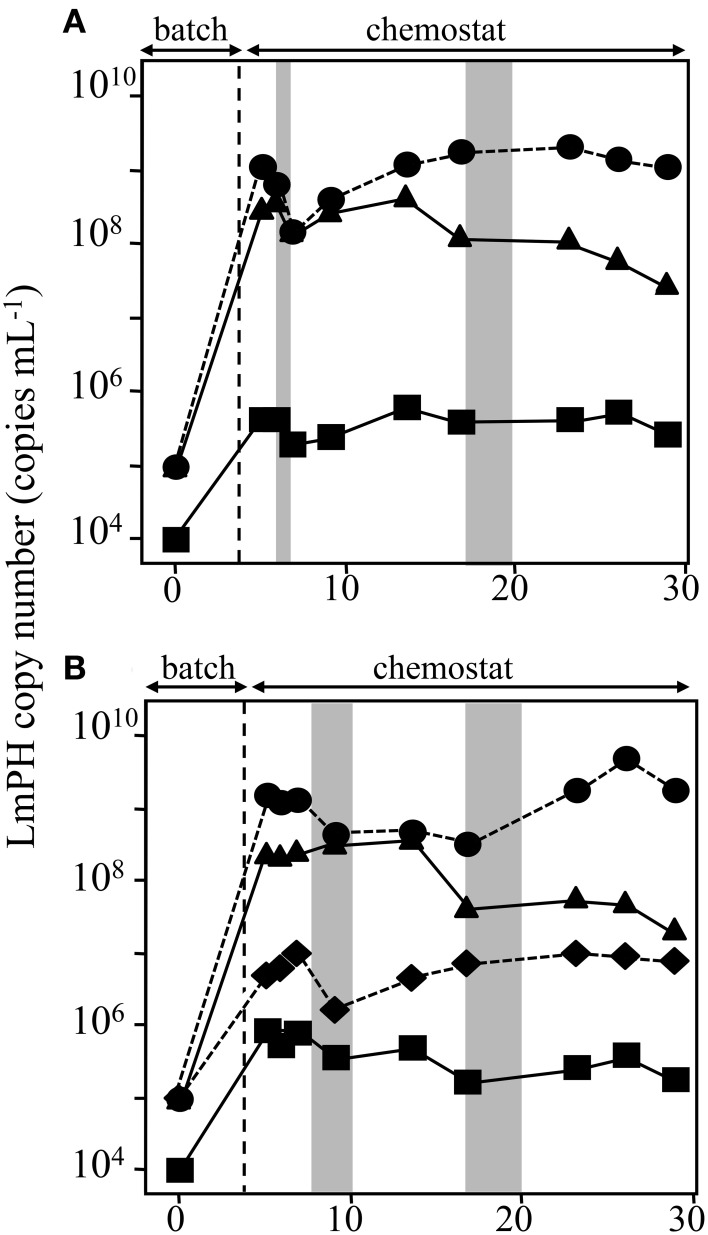
Figure 3.
Population dynamics in the chemostat reactors SMEI-2 and SMEI-3 run at a flow rate of 31.5 mL h−1 (a hydraulic residence time of 2.0 days). The deduced population densities of the strains in the mixed chemostat culture were monitored using real-time qPCR targeting the gene encoding LmPH. (A) Monitoring of the bacterial populations in the SMEI-2 reactor. Psuedomonas putida P-8 (▴) Acinetobacter sp. c26 (•), and Variovorax sp. HAB-24 (■). (B) Monitoring of the bacterial populations in the SMEI-3 reactor. Psuedomonas putida P-8 (▴) Acinetobacter sp. c26 (•) Ralstonia sp. c41 (♦), and Variovorax sp. HAB-24 (■). Error bars are smaller than the symbol. Gray bar indicates the period when phenol was detected in the reactors.

