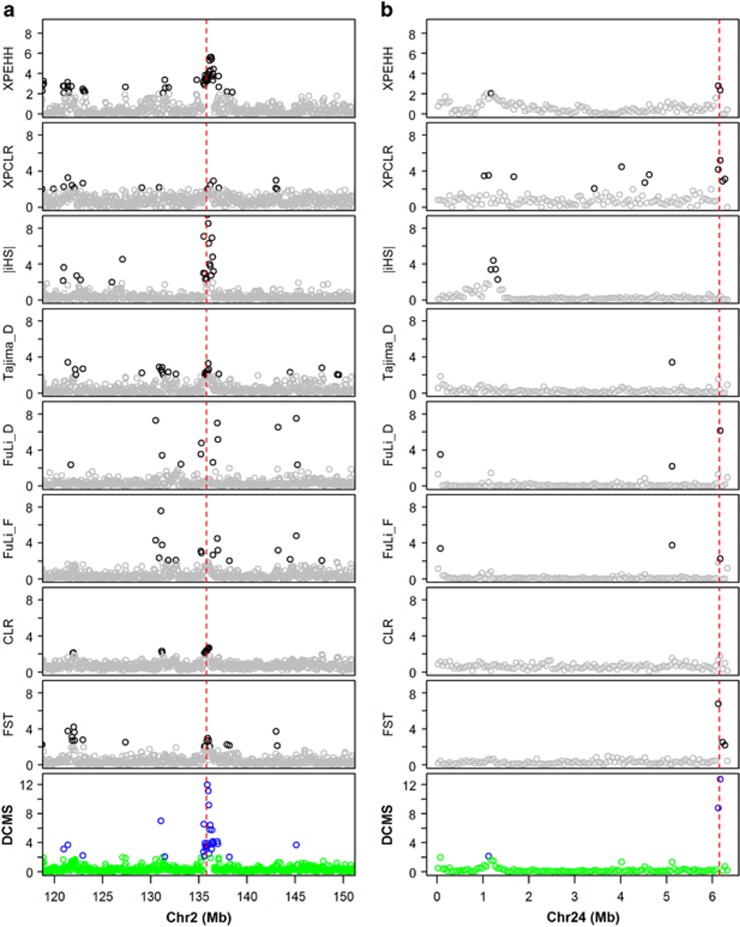
Figure 2.
Selection signature detected by DCMS in (a) Chromosome 2 in human HapMap data in the analysis of the CEU population vs the ASW population, (b) Chromosome 24 in the comparison of yellow skin vs white skin populations. The y axis reflects the −log (P-values). The red dashed line in (a) marks the location of the LCT gene in the human genome, and the red dashed line in (b) marks the location of the BCO2 gene in the chicken genome. The deep-colored symbols represent the P-value of statistical scores for each statistic less than 1%.

