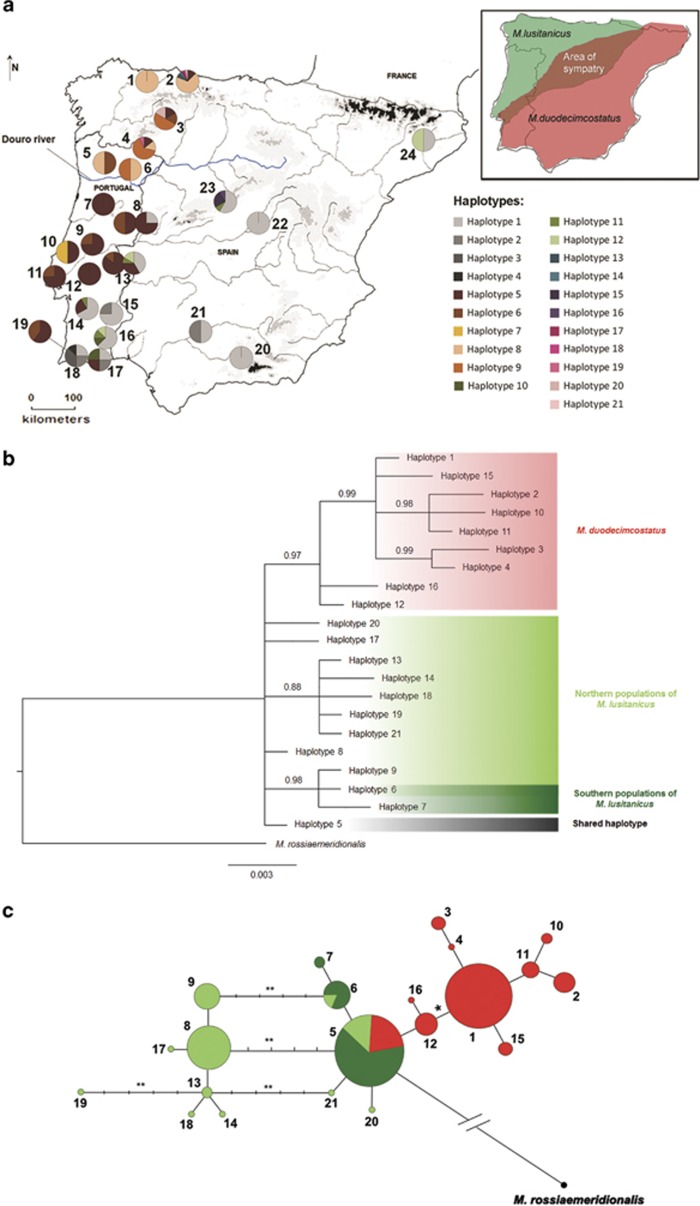
Figure 1.
Distribution of p53 haplotypes in the Iberian Peninsula and respective phylogenetic and network relationships. (a) Map of the Iberian Peninsula showing frequency distributions of p53 haplotypes from M. lusitanicus and M. duodecimcostatus according to sampling site (numbered 1 to 24). In sampling sites 8 and 13 the left pie corresponds to M. lusitanicus and the right pie to M. duodecimcostatus. Sampling sites and haplotype labels are as in Supplementary Table S1. Shaded areas of the map denote altitude gradients, with darker areas corresponding to higher altitudes. Douro river is highlighted in blue. Top right corner: distribution range of each species in the Iberian Peninsula (green: M. lusitanicus; red: M. duodecimcostatus; brown: area of sympatry). (b) Phylogenetic relationships among p53 haplotypes, according to the Bayesian inference analysis and with M. rossiaemeridionalis as the outgroup. Numbers above branches represent posterior probabilities. Maximum likelihood inferred the same topology but with lower branch support. Northern and southern populations of M. lusitanicus are located north- and southward of the Douro river, respectively. (c) Median-joining network of the 21 p53 haplotypes found in M. lusitanicus and M. duodecimcostatus and the haplotype from M. rossiaemeridionalis. Numbers of circles correspond to the respective haplotypes as in a and b. Colours of circles correspond to species and regional populations as in b. Areas of the circles in the network are proportional to the haplotype frequency. Each bar on the connecting lines separates two mutational events except between haplotype 5 and haplotype from M. rossiaemeridionalis (18 mutational steps). * Mutational event corresponding to a non-synonymous mutation in P53 protein; ** Mutational event corresponding to an additional repeat motif (5 bp) in intron 6.

