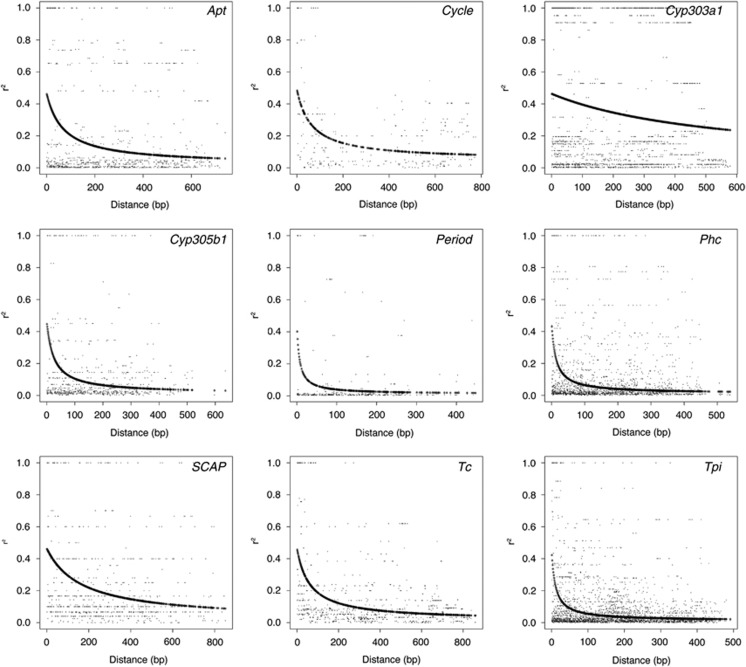
Figure 1.
Plots of r2 over physical distance in base pairs, with curves showing the decay of LD modeled on the expectations of Hill and Weir (1988). The approximate distance at which E(r2) decays to 0.2 (approximately half the maximum estimated value across all nine loci) for each decay curve is 104, 122, >579, 25, 7, 14, 186, 76 and 11 bp for Apt, Cycle, Cyp303a1, Cyp305b1, Period, Phc, SCAP, Tc and Tpi, respectively. Maximum values of E(r2) ranged from 0.39 to 0.51. The number of alleles sampled for each locus is reported in Table 1.

