
Figure 2.
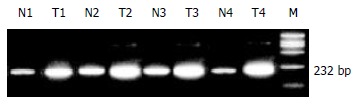
Representative COX-2 mRNA expression in gastric carcinoma tissues analyzed by RT-PCR. Lane M, molecular marker, from above down: 2000, 1000, 750, 500, 250, 100 bp. Lane N, noncancerous tissue; lane T, cancerous tissue.
Official websites use .gov
A
.gov website belongs to an official
government organization in the United States.
Secure .gov websites use HTTPS
A lock (
) or https:// means you've safely
connected to the .gov website. Share sensitive
information only on official, secure websites.
Representative COX-2 mRNA expression in gastric carcinoma tissues analyzed by RT-PCR. Lane M, molecular marker, from above down: 2000, 1000, 750, 500, 250, 100 bp. Lane N, noncancerous tissue; lane T, cancerous tissue.