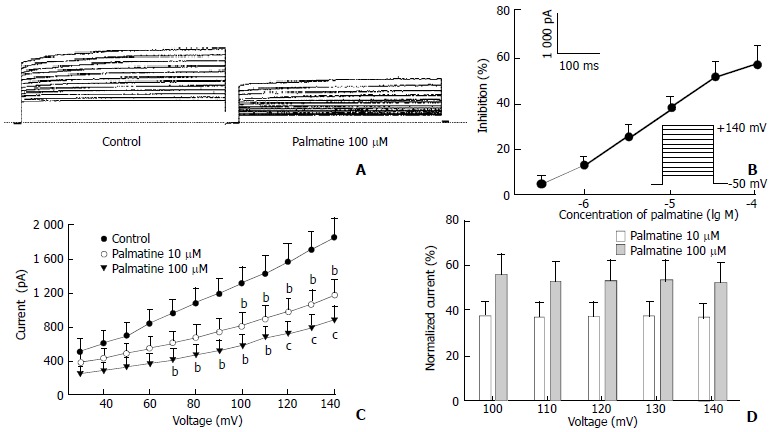
Figure 1.

Effects of palmatine on IK. (A) Family of IK recorded with changes in the absent or present of palmatine 100 μM. Dotted line indicates zero current level; (B) Dose-response curve for the effects of palmatine on IK. The data are mean values from n = 8 cells; (C) I-V relationship of IK under control (●) and palmatine 10 μM (▼), 100 μM (▼). The voltage steps used to elicit IK are shown in the inset of panel (B). bP < 0.05, cP < 0.01 versus control (n = 8); (D) Dependence of palmatine effects on test potential. The values for the mean percentage reductions in IK induced by palmatine 10 μM (□) and 100 μM (■) are plotted against the corresponding test potential. No significant voltage-dependence was observed for the blocks induced by palmatine.
