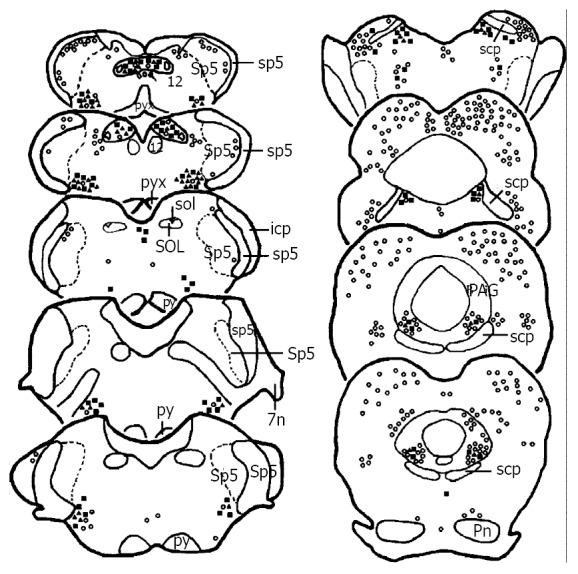
Figure 2.

Drawing of the brainstem areas showing the distribution of TH (■), Fos (○) and TH/Fos (▲) immunoreactive neurons after subcutaneous noxious stimulation on the left forepaw. The ratios for each marker to present the number of TH, Fos and TH/Fos immunoreactive neurons and the abbreviations are the same as Figure 1.
