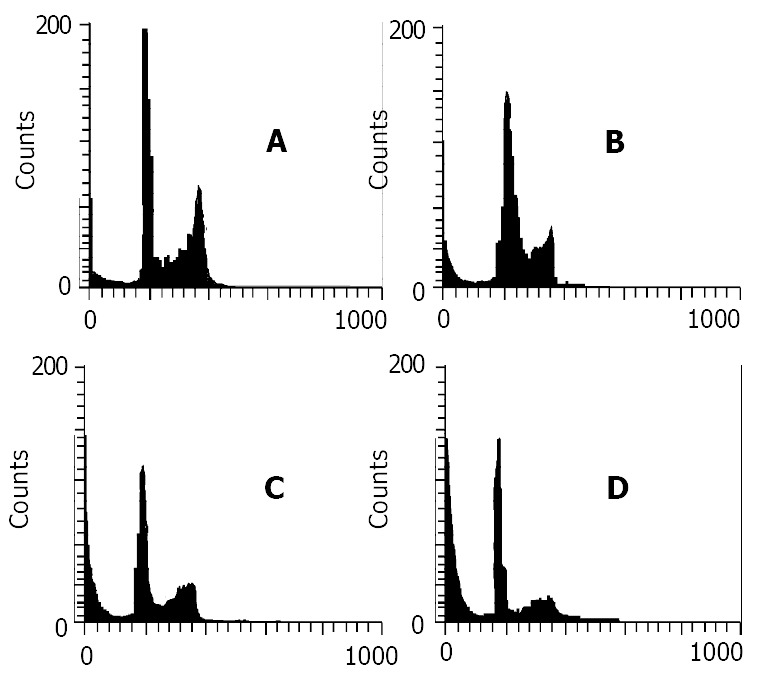
Figure 3.

Data of flow cytometry of mouse hepatoma without any treatment as a control (A), or following 21 d treatment with nimesulide 20 mg/kg (B), 5-FU 20 mg/kg (C) and nimesulide 20 mg/kg + 5-FU 10 mg/kg (D). The sub-G1 peak to the left of the G1 peak represents apoptotic cells.
