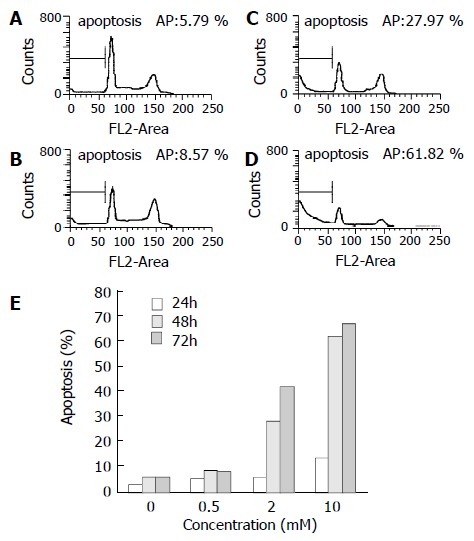
Figure 6.

Tributyrin-induced apoptosis in SGC-7901 cells by flow cytometry. (A) The control cells, (B)-(D) The experimental cells treated with tributyrin at 0.5, 2 and 10 mmol·L-1 respectively for 48 h. (E) Apoptosis rates in SGC-7901 cells treated with 0.5, 2 and 10 mmol·L-1 or without tributyrin for the indicated times.
