
Figure 4.
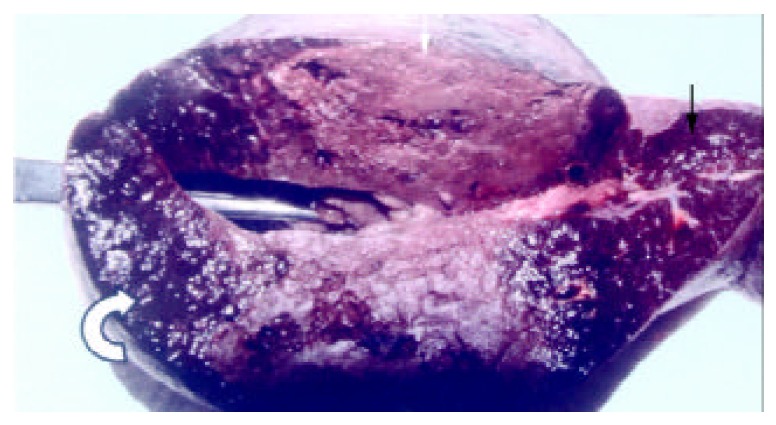
The appearance of the spleen the day after RFA, showed the lesion included the zone of soid-yellow dry necrosis (white arrow) and dark-red zone of thrombotic infarction (curve arrow), and the bright red normal spleen (black arrow); each ablation created a lesion with maximum diameter of 9 cm.