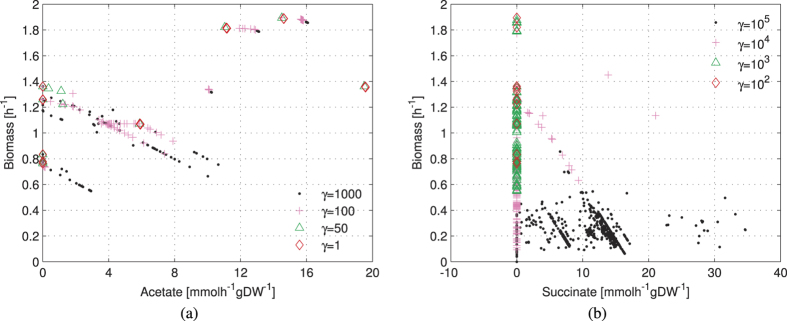
Figure 4.

The 466 profiles of gene expression (each associated with one condition) positioned in the two-dimensional space acetate-biomass (a) and succinate-biomass (b). The parameter γ represents the weight attributed to the variance as an indicator of the importance of a gene, and determines the effect of the gene expression values on the final reaction rates. By increasing the parameter γ we increase this effect, therefore even two experimental conditions with slight differences in the gene expression profiles are mapped to different points in the objective space. The map from genes to metabolism is robust with respect to perturbations of γ, while large perturbations of γ (orders of magnitude) increase the sensitivity of the metabolism to the different environmental conditions.
