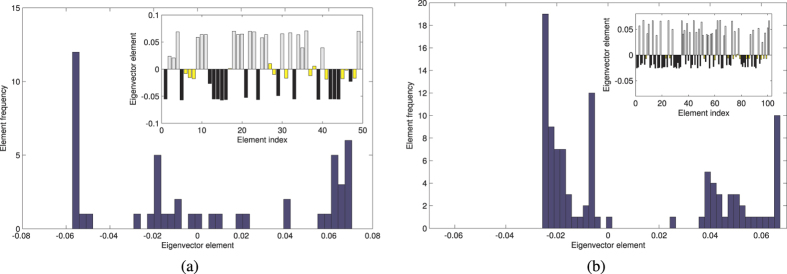
Figure 7. We build a flow matrix F of the largest connected component of D, and we plot the components of its Fiedler eigenvector. The sign of the components of the Fiedler eigenvector indicates the community to which nodes (i.e. conditions) belong80.

In finding community structures, the algorithm performs better in the acetate-biomass case (a), where it shows a bimodal distribution, rather than in the succinate-biomass case (b). For the latter case, a possible correction could be to move the community assignment threshold towards values greater than 0.
