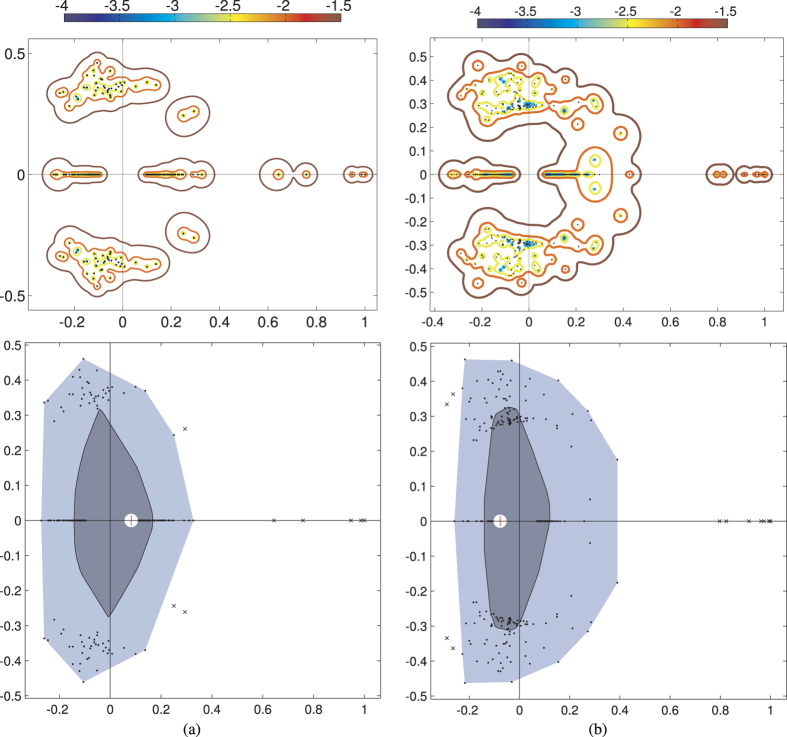
Figure 8. Pseudospectra of the flow matrix computed on the largest connected component of D with ε ranging from 10−4 to 10−1.5.
(a) Acetate-biomass space: for ε = 10−1.5, around the three leading real eigenvalues, the pseudospectrum is a connected set, while for ε = 10−2 and smaller values it consists of disjoint sets. (b) Succinate-biomass space: the largest connected component is bigger, indicating that the experimental conditions yield points close to each other in this output space. There is a clear distinction between the seven leading real eigenvalues and the rest of the spectrum. The bagplot (bottom) shows that the median eigenvalue (red “plus” sign) is remarkably different in the two cases: in the succinate-biomass space, it has a negative real part. The eigenvalues are closer to each other in the succinate-biomass space, since the inner bag (dark grey) containing the 50% of them is less spread than in the acetate-biomass space.

