
Figure 4. The ROC curves obtained by different methods on the independent dataset PDB186.
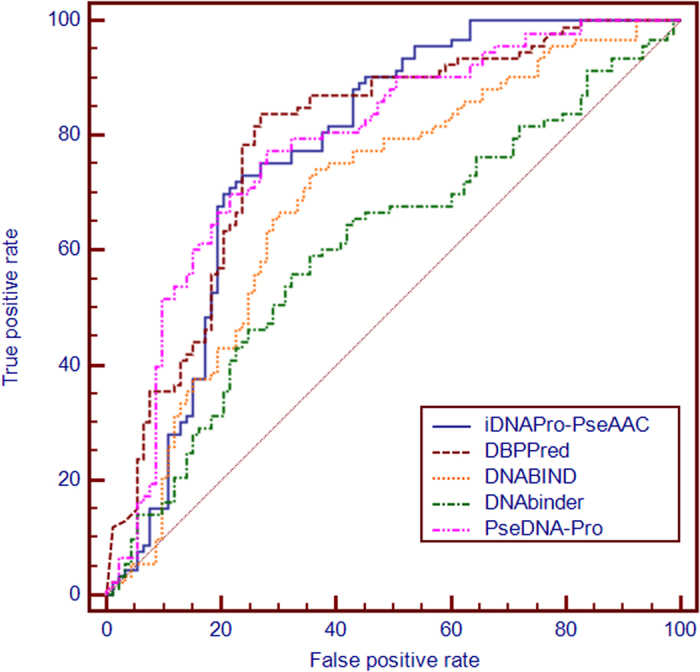
The areas under the ROC curves or AUC are 0.775, 0.607, 0.694, and 0.791 for iDNAPro-PseAAC, DNAbinder, DNABIND and DBPPred, respectively. See the main text for further explanation.