
Figure 5. The ROC curves obtained by different iDNAPro-PseAAC predictors on the independent dataset PDB186.
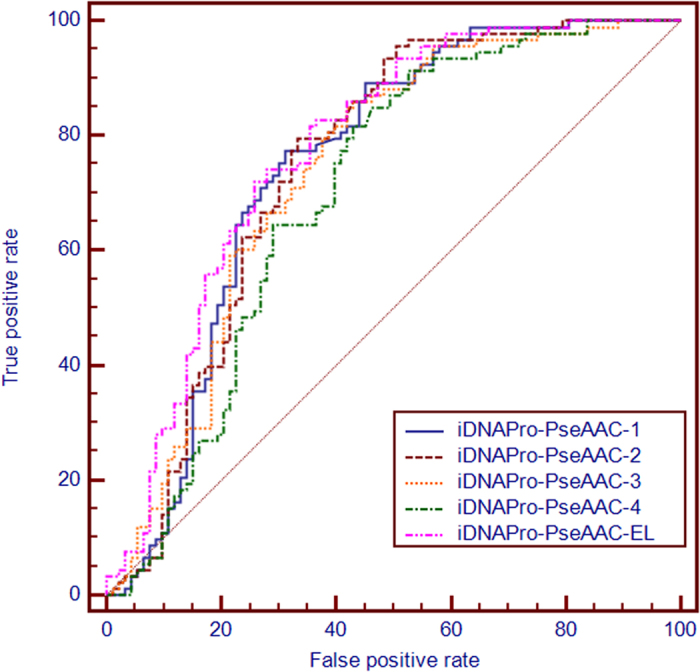
The areas under the ROC curves or AUC are 0.750, 0.750, 0.741, 0.702, 0.778 for iDNAPro-PseAAC-1, iDNAPro-PseAAC-2, iDNAPro-PseAAC-3, iDNAPro-PseAAC-4, and iDNAPro-PseAAC-EL, respectively.