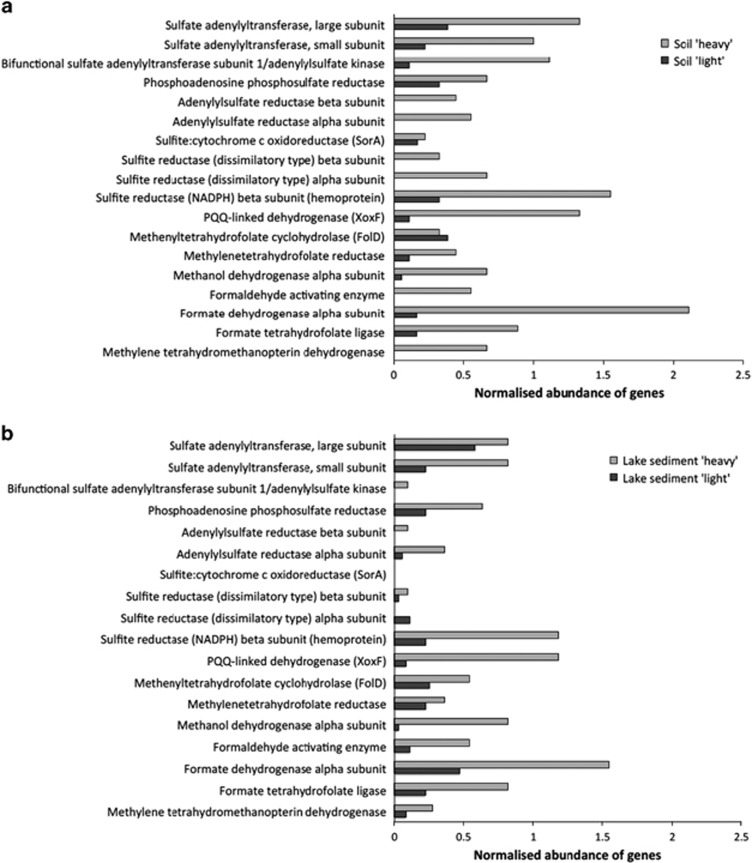
Figure 5.
Relative abundance of methylotrophy- and sulphur-related functional genes relative to recA (single copy control gene) in ‘heavy' and ‘light' metagenomes. Dark grey bars represent the ‘light' DNA and light grey bars represent the ‘heavy' DNA. (a) Soil, (b) Lake sediment. Numbers are based on features identified in assembled reads of the metagenomes as shown in Supplementary Table 4.

