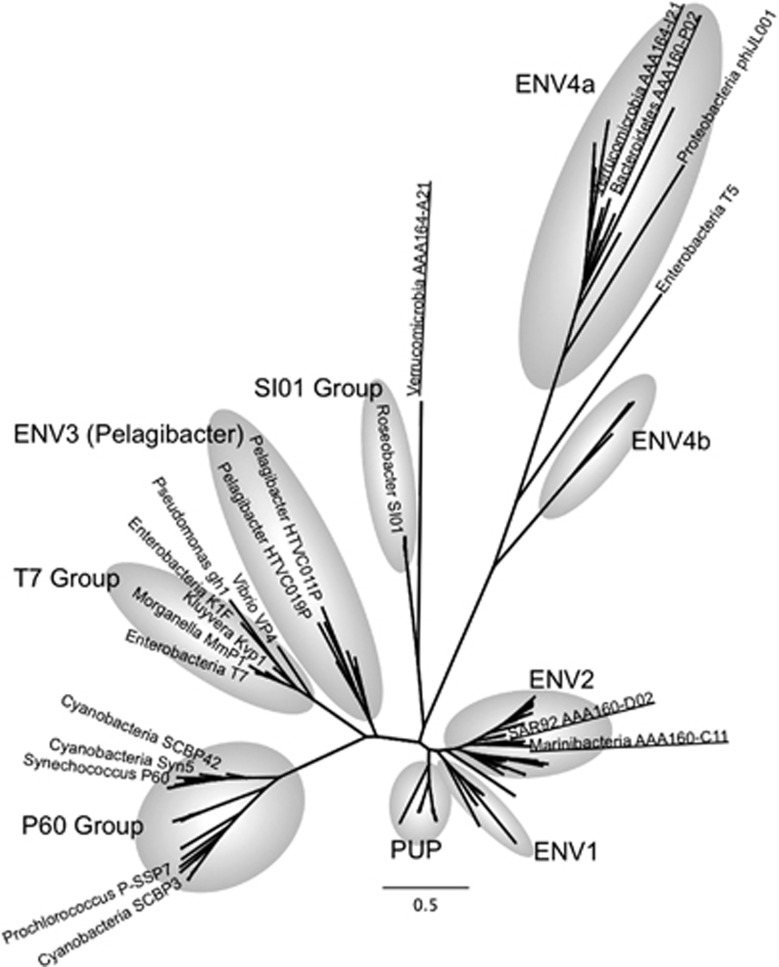
Figure 3.
Phylogenetic analysis of the Podoviridae-like DNA polymerase A from SAGs (underlined), isolates (labeled) and metagenomes (not labeled). The grey shading indicates the pre-defined groups from Schmidt et al. (2014) and Labonté et al. (2009). The tree was generated using maximum likelihood, with 100 bootstrap replicates, using the LG model with a gamma distribution (+G), estimated rates of variation among sites and a proportion of invariable sites (+I). Bootstrap replicates are not shown for clarity. Scale bar represents the number of amino acid substitution per site.

