Figure 2.
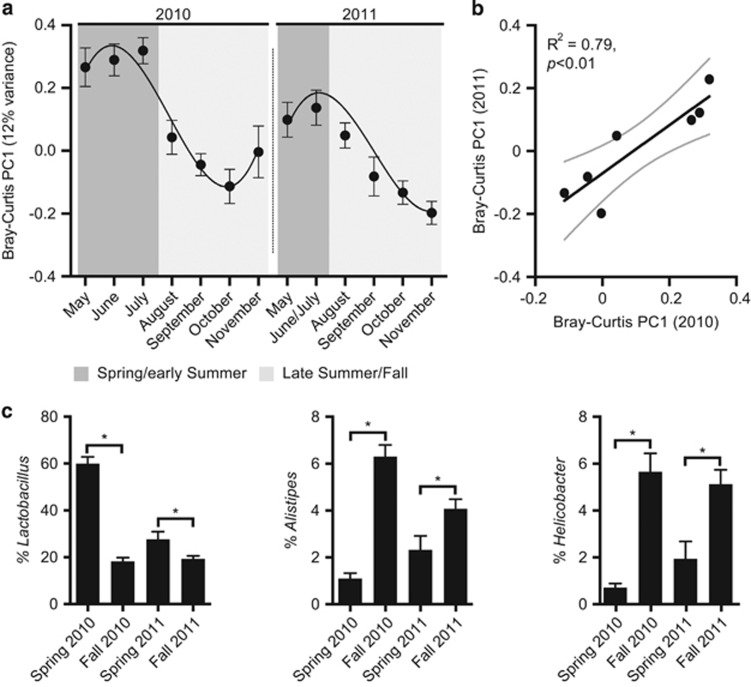
Seasonal variations in the wild mouse gut microbiota. (a) The first principle coordinate from a Bray–Curtis-based analysis of microbial community structure over time. Trend lines were generated by fitting a polynomial function to values from each year (GraphPad Prism version 6.0). Values are mean±s.e.m. (n=14–80 samples per group). Values from June and July were combined in 2011 owing to limited available samples in July (n=2). (b) Association between average monthly microbial community structures between years. Values are mean (thick black line) and 95% CI (thin grey lines) from a linear regression. (c) The relative abundance of bacterial genera in spring and fall of both years. Values are mean±s.e.m. (n=24–123 samples per group; the first sample from each mouse was included). Asterisks represent significant differences (P-value<0.05, Wilcoxon rank-sum test).

