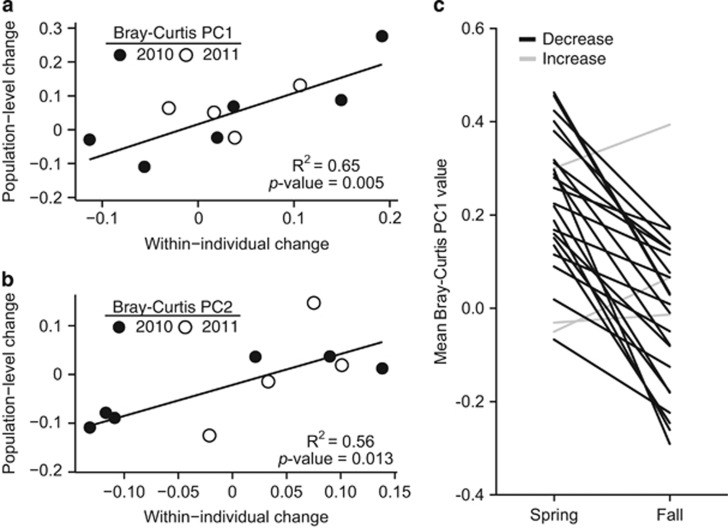
Figure 3.
Seasonal patterns are detectable within-individuals captured multiple times. Correlations between the mean month-to-month change in Bray–Curtis principle coordinates 1 (panel a) and 2 (panel b) within-individuals, relative to the monthly change observed at the population level (including only one pair of observations per mouse; n=2–11 paired samples per datapoint). Dots represent monthly changes seen in 2010 (black) and 2011 (white). See Supplementary Figure S4 for plots of individual animals over time. (c) We calculated the mean value of Bray–Curtis principal coordinate 1 value for each mouse in Season 1 (spring/early summer) and 2 (late summer/fall) (n=25 mice; less than equal to one sample per mouse per month included). Nearly all mice exhibited a consistent direction of change (black lines), with the exception of three animals (grey lines).

