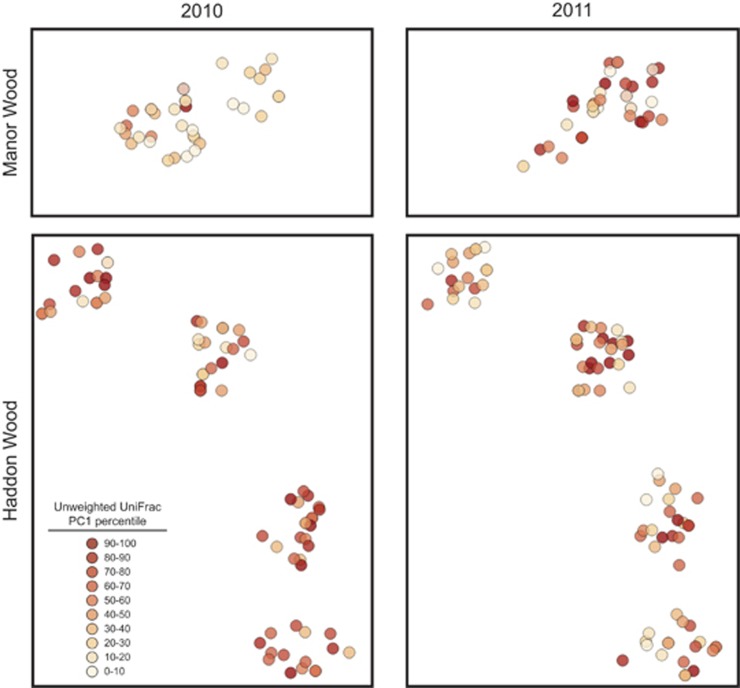
Figure 4.
Spatial distribution of microbial community structure. Each circle represents the physical location of a given mouse at the time of sampling in Manor or Haddon Wood, which are subdivided into two and four trapping grids, respectively. Shading is proportional to the percentile along unweighted UniFrac principal coordinate 1 (an indication of overall microbial community membership). Between August and November in 2010 there was a slight but significant difference in community composition between Haddon and Manor woods. However, this difference was absent in August to November 2011. Within woods, no significant spatial structuring of communities was observed in either year.

