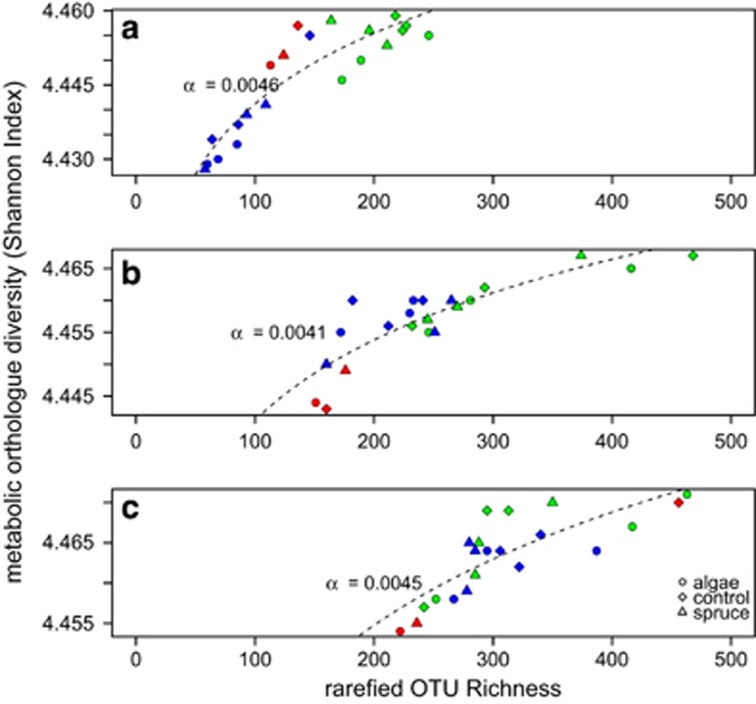
Figure 5.
Metabolic orthologue accumulation curves for sites above (a), at (b) and below the treeline (c). Shown are all treatments (see legend for symbols) at the three sites (green—OTB, red—SRB, blue—RB). For each position in the landscape (a–c), the three different streams (colours) occupy different positions on the power-law function, indicating the metabolic multifunctional differences between the three locations, whereas the DOC amendments did not result in obvious changes in multifunctionality. Given are the exponents of the power-law function (dashed lines), which indicate multifunctional redundancy. Multifunctional redundancy slightly increases along the longitudinal gradient, with a peak around the treeline.

