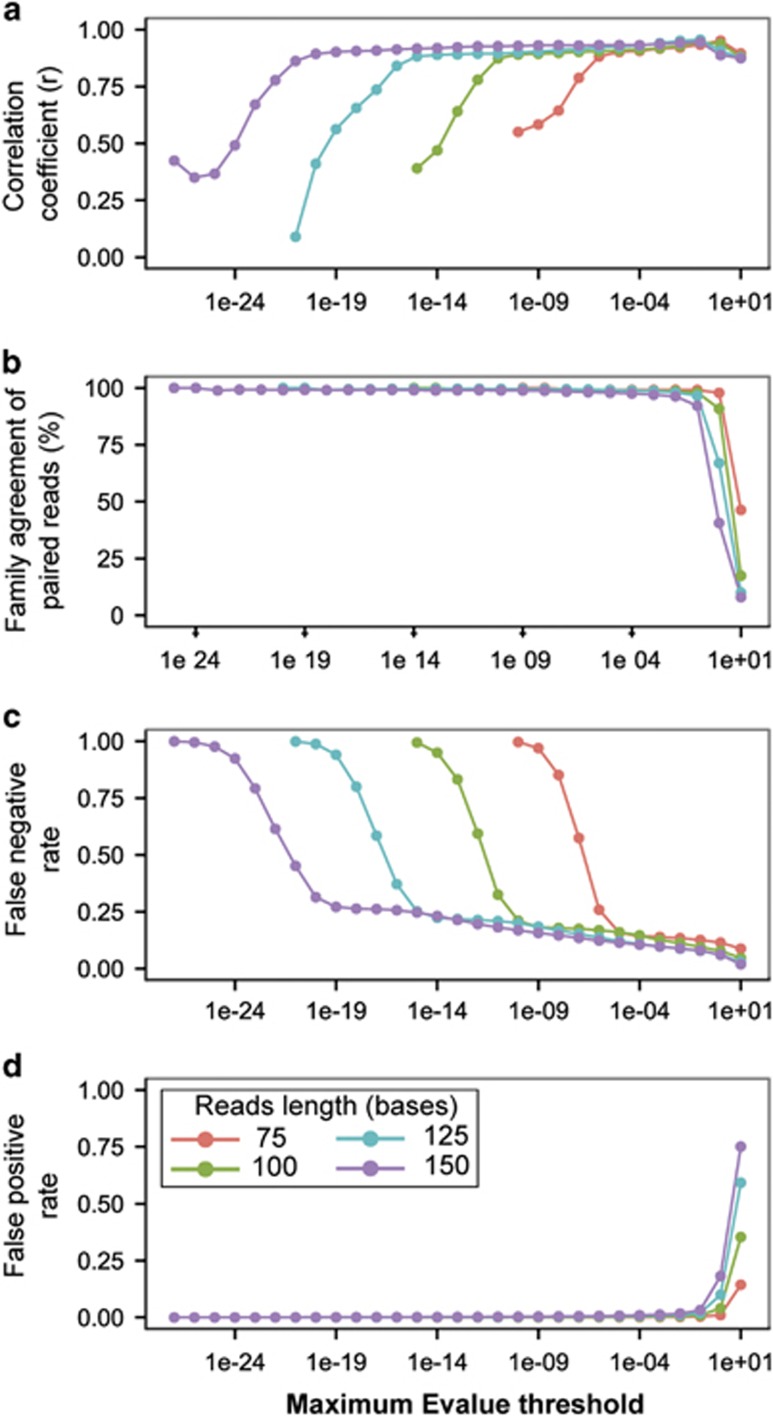
Figure 2.
Effects of read length and E-value threshold on accuracy of CAZy gene analysis using simulated, unassembled sequencing reads from the Rhodococcus jostii complete genome. (a) Correlation between the experimental and expected gene family relative abundance profiles. (b) Agreement between family level identification of paired-end reads. (c) False negative gene identification. (d) False positive gene identification.

