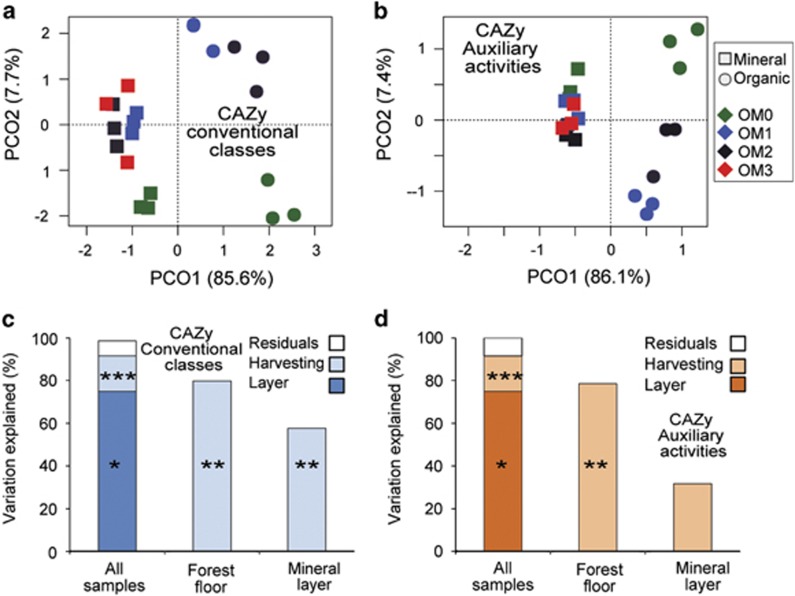
Figure 4.
Variation of CAZy gene family profiles. Principal coordinates ordinations of gene family profiles of conventional CAZy classes (a) and the AA class (b). Percentages indicate the amount of that variability explained by the corresponding axis. Variation of gene family profiles for conventional CAZy classes (c) and the AA class (d) explained by soil layer and harvesting treatments, according to permutational multivariate analysis of variance (PERMANOVA) (*P<0.05, **P<0.01, ***P<0.001).

