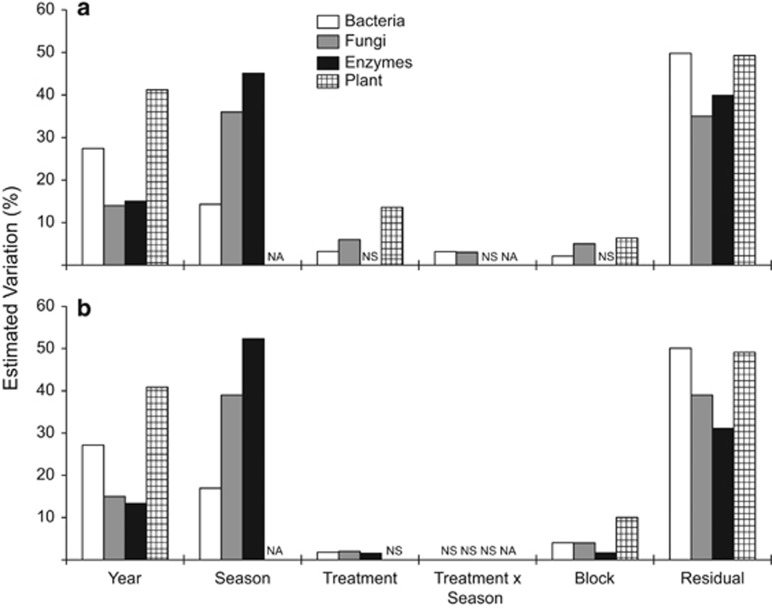
Figure 1.
PERMANOVA multivariate components of variation for the bacterial (white), fungal (gray), microbial enzymes (black) and plant (checkered) communities for each the drought (a) and nitrogen addition (b) treatments (average based on 999 unique permutations). Data include samples from all collection dates (8 in total for microbial communities, 7 for enzyme concentrations and 2 for plant community). The values plotted are the proportional sizes of the estimates of the variance components. All P-values <0.05.

