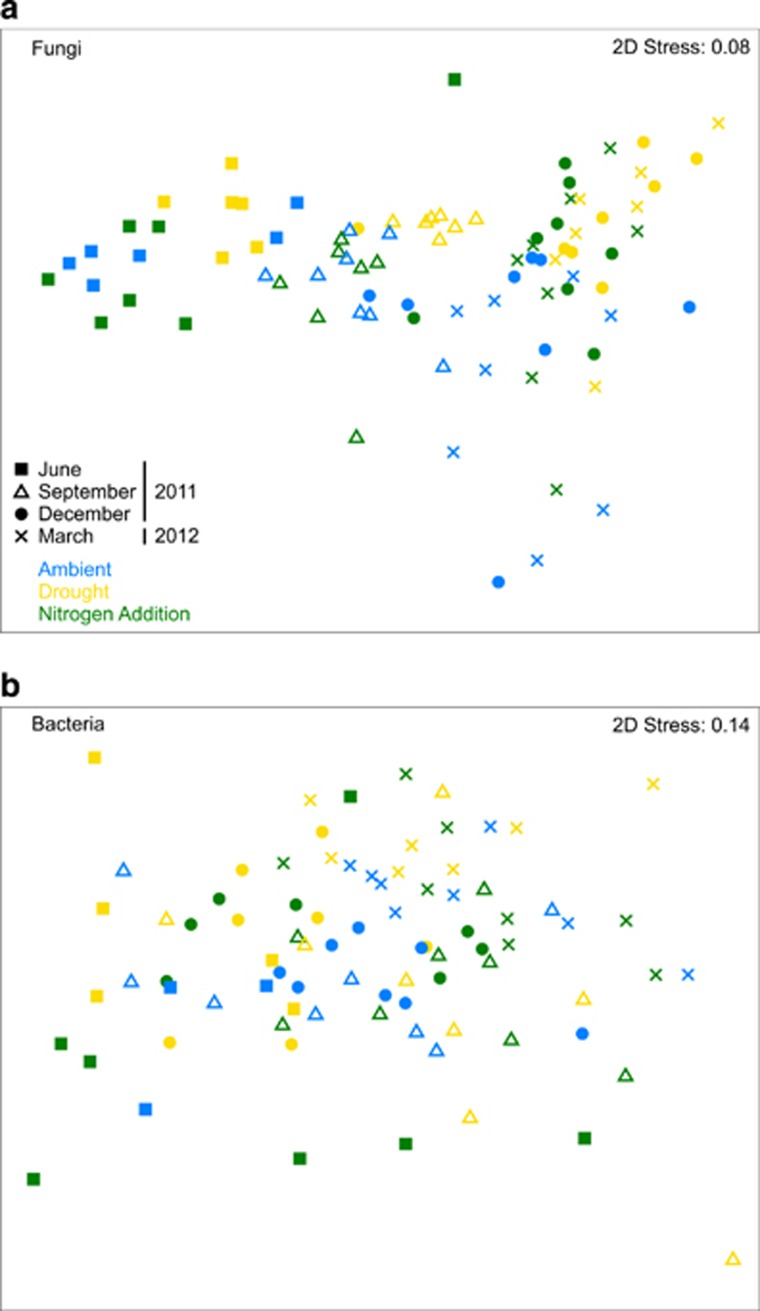
Figure 2.
Non-metric multidimensional scaling ordination based on Bray–Curtis similarities depicting (a) fungal and (b) bacterial community composition in the second sampling year. The samples collected during the same collection date are displayed in the same symbol. The color of the symbols represent the plot treatment: ambient conditions (blue), drought (yellow), or nitrogen addition (green).

