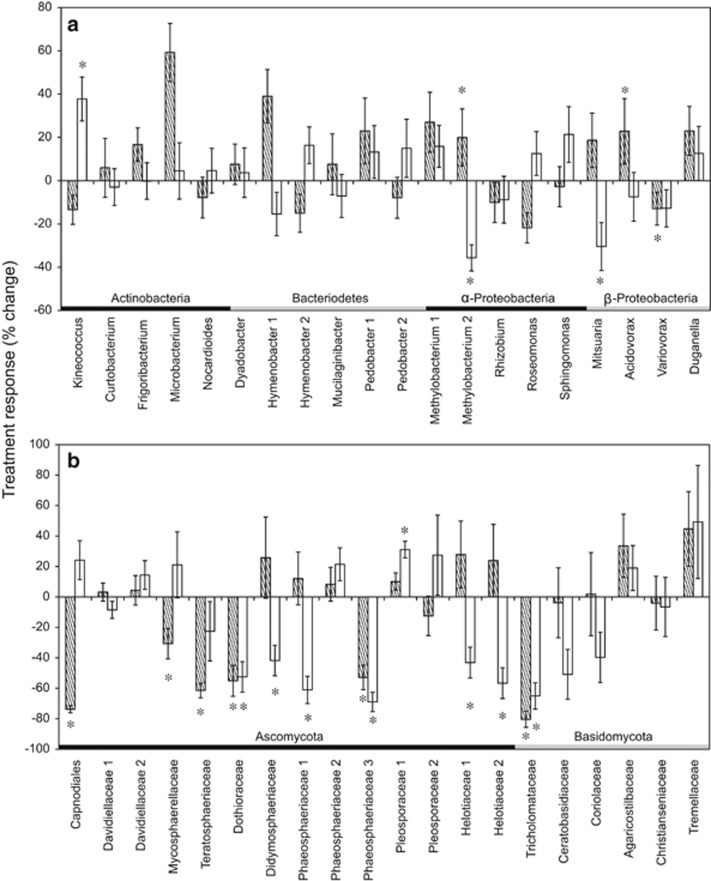
Figure 4.
Percentage of change (mean±s.e.) in relative abundance of the 20 most common (a) bacterial and (b) fungal OTUs in nitrogen addition (diagonal) or drought (white) plots relative to ambient plots across all collection dates. Asterisks (*) denote P-value of <0.05 in two sample t-test between the ambient and drought or nitrogen treatments.

