
Figure 1.
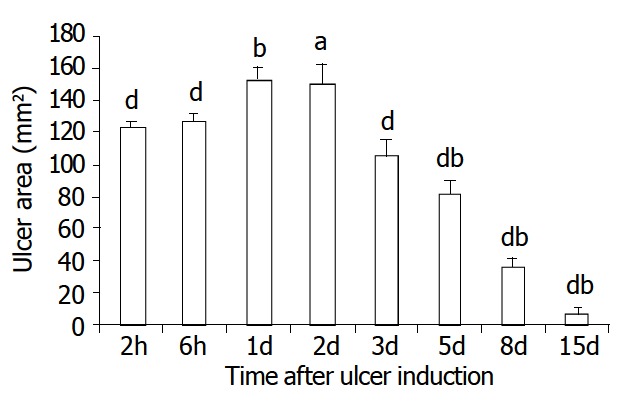
Sequential change of ulcer areas at different time points after ulcer induction. Significant decrease of ulcer area was found on day 3 after ulcer induction. The data were represented as mean ± S. E. M of 20 rats in each group, aP < 0.05 vs the 2 h group; bP < 0.001 vs the 2 h group; dP < 0.001 vs the day 1 group.