
Figure 6.
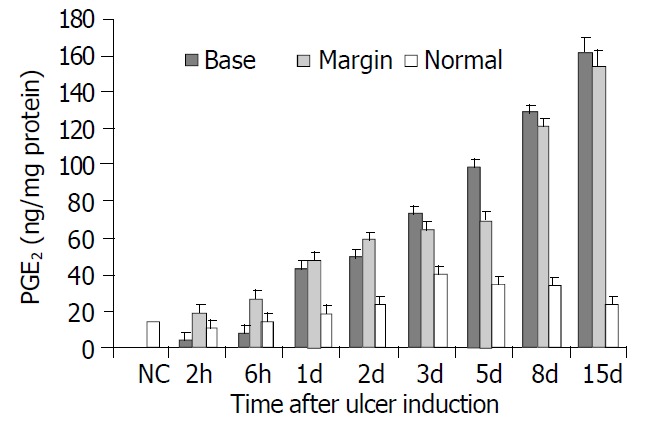
COX activities in the gastric tissues of normal control rats (NC) and the non-ulcerated tissues, ulcer margins and ulcer bases of acetic acid induced gastric ulcer. Each bar rep-resents the mean ± S.E.M of 8 rats in each group.
Official websites use .gov
A
.gov website belongs to an official
government organization in the United States.
Secure .gov websites use HTTPS
A lock (
) or https:// means you've safely
connected to the .gov website. Share sensitive
information only on official, secure websites.
COX activities in the gastric tissues of normal control rats (NC) and the non-ulcerated tissues, ulcer margins and ulcer bases of acetic acid induced gastric ulcer. Each bar rep-resents the mean ± S.E.M of 8 rats in each group.