Figure 3.

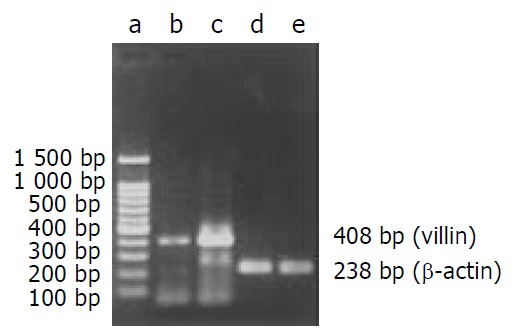
RT-PCR products from IEC-6 cells on agarose electrophoresis. a: Marker (brighter band: 500 bp), b: Control, c: Gastrin treated cells, d: β-actin(Control), e: β-actin (Gastrin).

RT-PCR products from IEC-6 cells on agarose electrophoresis. a: Marker (brighter band: 500 bp), b: Control, c: Gastrin treated cells, d: β-actin(Control), e: β-actin (Gastrin).