
Figure 1.
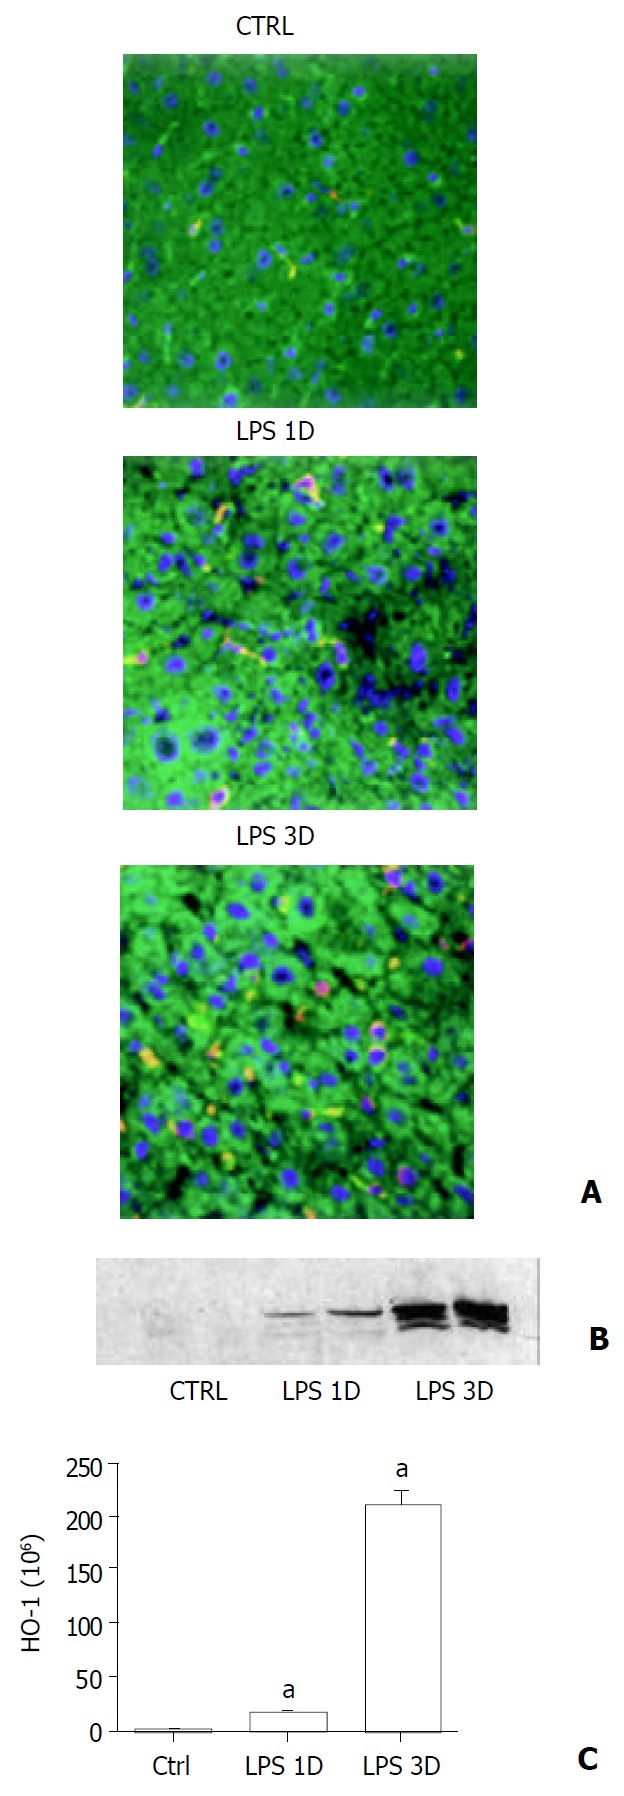
Liver HO-1 expression in wild type mice. A: Immun-ofluorescent detection of HO-1 in liver. After different doses of LPS or sham treatment, liver HO-1 expression of wild type (C57) mice were visualized by immunofluorescent staining with a specific rabbit polyclonal antibody against HO-1 fol-lowed by indocarbocyanine (Cy3)-conjugated anti-rabbit IgG (red). The cell surface was counterstained with fluorescein-con-jugated wheat germ agglutinin (green), and the nucleus was counterstained with bis-benzimide (blue). HO-1 was present in liver of sham-treated animals (Ctrl). A single dose of LPS treatment increased liver HO-1 expression (LPS 1D). Furthermore, HO-1 expression was enhanced by three doses of LPS treatment (LPS 3D, magnification ×400). B: Immunoblotting detection of HO-1 in liver. C57 mice were treated with vehicle (Ctrl), single dose of LPS (LPS 1D) and three doses of LPS (LPS 3D). Liver tissue was homogenized, and immunoblotting analysis was performed. HO-1 protein was detected by immunoblotting with polyclonal rabbit antibody against HO-1. Data were representative of at least 2 experiments. C: Im-munofluorescent staining to quantitate HO-1 expression. Liver HO-1 expression was determined by immunofluorescent staining. Integrated intensity of HO-1 positive signal was masked and quantified by using Slidebook software (I. I. I. Inc., Denver, CO). aP < 0.05 vs. sham.