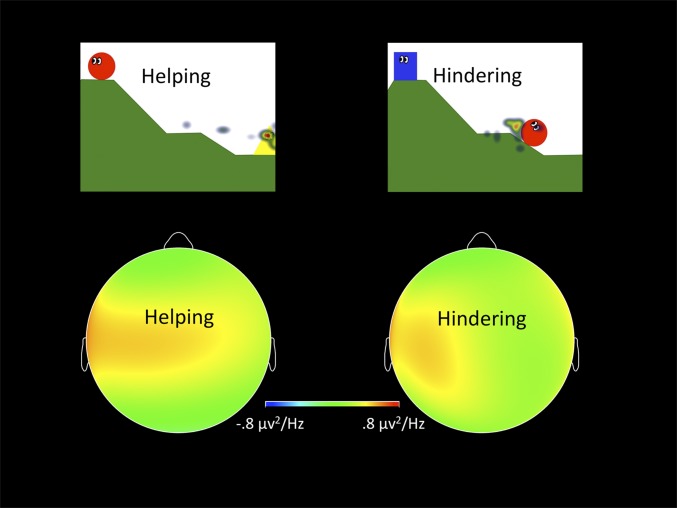
Fig. 1.
Scalp plots of the power density in the 5–8 Hz range for SET, characterized by a significant difference in asymmetry for hindering versus helping scenes. On the top are representative heat maps of toddlers’ visual fixations. Children fixated significantly longer on the helping agent than on the beneficiary of helping.

