
Fig. S2.
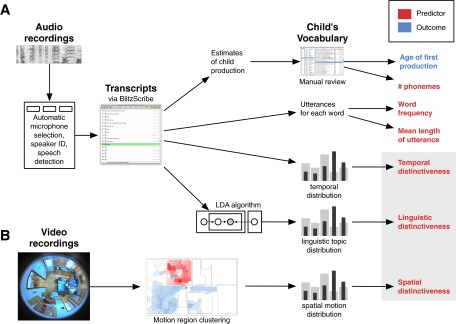
Schematic of data collection and processing for our dataset, leading to our outcome (blue) and predictor (red) variables. (A) Audio recordings are filtered automatically for speech and speaker identity and then transcribed. Transcripts are used for the identification of the child’s productions, extraction of frequency, MLU, and temporal distinctiveness predictors, as well as for clustering via topic models (LDA) to extract the linguistic distinctiveness measure. (B) Video recordings are processed via motion-based clustering. Region-of-motion distributions for each word are then compared with a base motion distribution for all linguistic events, yielding the spatial distinctiveness predictor.