Significance
We present X-ray speckle tracking tomography, a simple, robust, and versatile method to obtain simultaneously phase and absorption tomograms of the sample at the micrometer scale with a laboratory X-ray source. The method is based on correlation of near-field speckles and yields quantitative measurements of the full X-ray refractive index of the object with high sensitivity. X-ray speckle tracking tomography broadens the capabilities of X-ray imaging at laboratory sources with strong potential in materials and life sciences.
Keywords: X-ray imaging, near-field speckles, phase-contrast imaging, refractive index measurement, microtomography
Abstract
Nondestructive microscale investigation of objects is an invaluable tool in life and materials sciences. Currently, such investigation is mainly performed with X-ray laboratory systems, which are based on absorption-contrast imaging and cannot access the information carried by the phase of the X-ray waves. The phase signal is, nevertheless, of great value in X-ray imaging as it is complementary to the absorption information and in general more sensitive to visualize features with small density differences. Synchrotron facilities, which deliver a beam of high brilliance and high coherence, provide the ideal condition to develop such advanced phase-sensitive methods, but their access is limited. Here we show how a small modification of a laboratory setup yields simultaneously quantitative and 3D absorption and phase images of the object. This single-shot method is based on correlation of X-ray near-field speckles and represents a significant broadening of the capabilities of laboratory-based X-ray tomography.
Near-field speckles are observed when the granular diffraction pattern created by a random phase modulator (diffuser) is recorded in the near-field regime. This speckle intensity pattern has interesting properties: it is not dependent on the propagation distance if the near-field condition is satisfied (1), near-field speckles can be observed also with beams of low longitudinal coherence, and the speckle pattern reflects the spatial properties of the scatterers used to generate it (2).
Although speckles are a well-known phenomenon especially in the far field and for different wavelengths, e.g., from radio waves to visible light, the first observation and characterization of near-field speckles with X-rays was achieved in 2008 by Cerbino et al. who reported on measurements performed with synchrotron radiation (1). After this first experiment, X-ray near-field speckles have been used at synchrotron facilities for, among other applications, coherence measurements, optics characterization, and imaging (3–5).
The principle of speckle-based imaging is to quantify the effect on the speckle pattern by the sample through a windowed correlation between a pair of images taken with and without sample. This correlation quantifies the distortion of the speckles caused by the sample and yields accurate information on its refraction and thus phase-shifting properties. Moreover, it simultaneously provides the complementary absorption image of the investigated object (4–6). Because near-field speckles exhibit sufficient contrast also when a beam with a low degree of temporal coherence is used, near-field speckle-based techniques are not limited to large-scale synchrotron facilities, but can also be implemented with polychromatic laboratory X-ray sources. Such an experiment has been demonstrated using a high-brightness liquid-metal-jet source (7) making this imaging method available for widespread use (6).
Up until now, near-field speckle-based X-ray imaging has been performed only in projection mode (2D imaging). No extension to 3D imaging (tomography) has been reported up to now, neither with synchrotron nor with laboratory-based source data. Although simple and fast at detecting inner structures in the sample, projection imaging does not provide the location of features within the volume, nor the spatially dependent complex-valued refractive index [] of the object. To access this quantitative 3D information, one has to acquire a tomographic volume, obtained by combining the projections taken at different viewing angles of the sample. With speckle-tracking tomography, two inherently registered volumes that carry complementary information are obtained simultaneously from the same dataset: (i) the spatial distribution of the decrement of the refractive index δ from the phase projections and (ii) the spatial distribution of the linear attenuation coefficient μ (which is proportional to the imaginary part of the refractive index β according to ) from the absorption projections. Thus, the full refractive index (at X-ray wavelength) of the entire object can be accessed with a single measurement.
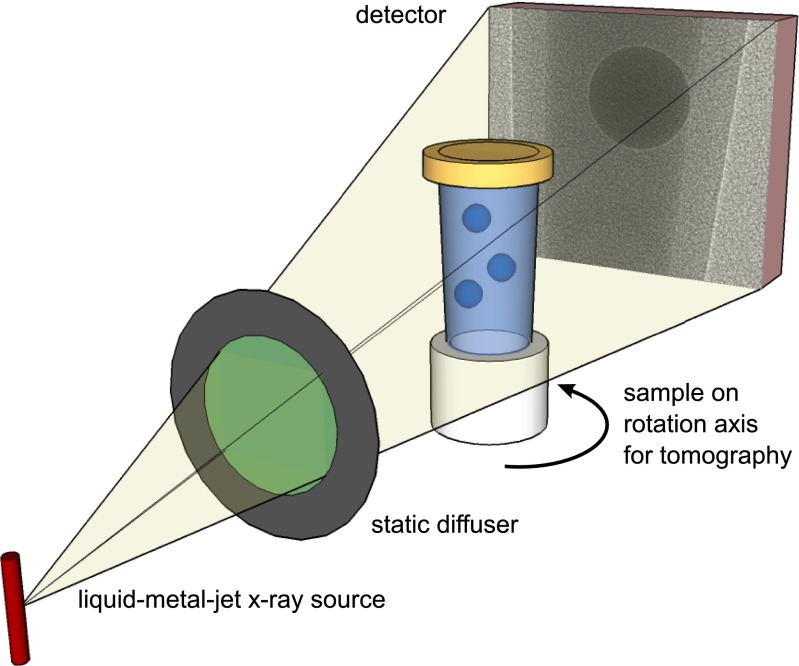
We demonstrate the potential of near-field speckle-based tomography and the importance of the phase information to complement the conventional absorption signal on a phantom sample made of known low-absorbing materials with similar refractive indices. As represented in Fig. 1, the X-ray generator was a liquid-metal-jet source, and the diffuser, a piece of sandpaper, was located between the source and the sample. More details on the setup and experimental parameters are reported in Methods.
Fig. 1.
Experimental setup. The high-brightness X-ray beam produced by the liquid-metal-jet source is modulated by a static diffuser. The sample is mounted downstream on a translation stage for collection of reference images and sits on a rotation stage to perform the tomographic scan. The optical properties of the sample are encoded as distortions in the near-field speckle pattern produced by the diffuser and collected by a pixel array detector.
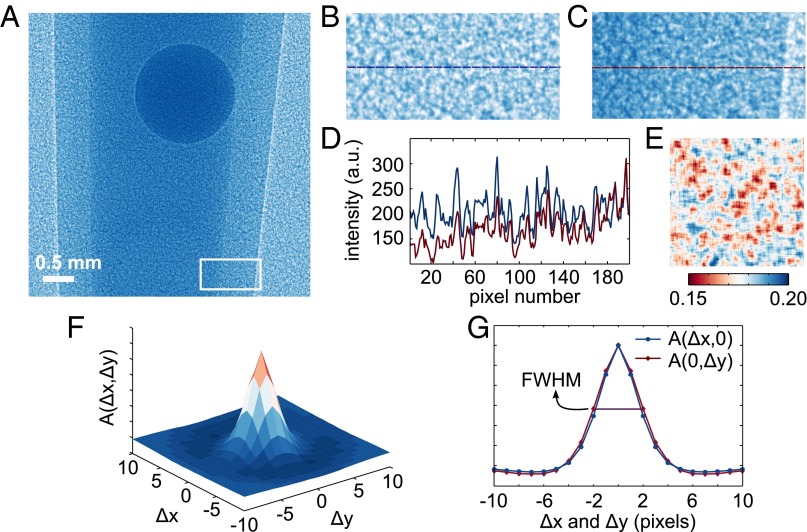
The near-field speckle pattern obtained using this arrangement is shown in Fig. 2. The image of the sample superimposed on the speckle pattern is shown in panel a. The sample was a polypropylene (PP) cylinder filled with water containing three plastic spheres with a diameter of 1.5 cm: two spheres of polymethylmetacrylate (PMMA) and one sphere of polytetrafluoroethylene (PTFE). In Fig. 2A, the PTFE sphere is clearly visible within the container walls at the top of the image, whereas the two PMMA spheres below have absorption properties similar to the surrounding water and are therefore indistinguishable in the raw data. Regions of interest (ROIs) extracted from the raw data are shown in Fig. 2 B (without sample) and C (with sample). The high-contrast speckle structure can be clearly seen in both ROIs and the modifications of the speckles by the sample are highlighted in the profile plot in Fig. 2D. An important feature of the speckle pattern, which affects the quality of the retrieved data, is its visibility. To avoid outliers, we evaluated the visibility v as the ratio , where and are the SD and the average value of the intensities measured in a window of pixels. To explore the change in visibility over the field of view, the center of the window was scanned over the entire image. The resulting “visibility map” is shown in Fig. 2E. The values obtained in this way vary between 15% and 20%. The patches in Fig. 2E are caused by the extent of the window used to calculate the visibility. The 2D autocorrelation function of the reference pattern in Fig. 2 F and G is used to estimate the size of the near-field speckles at the observation plane. The plots in Fig. 2G are sections through the and axes of the autocorrelation image. The full width at half maximum of these plots, which we relate to the size of the speckles, is of 3.8 and 4.1 pixels for x and y, respectively. This finding can also be observed in Fig. 2 B–D and reflects the asymmetry of the X-ray source with measured size of 6.0 (h) × 7.9 (v) μm2.
Fig. 2.
Characterization of the near-field X-ray speckle pattern. (A) Projection image of the sample superimposed on the speckle pattern as recorded during the tomographic scan. Enlarged views of the speckles in the region-of-interest (200 100 pixels) indicated with a white box in A are shown (B) without and (C) with sample, respectively. (D) Comparison of the profile plots taken at the dashed lines in B and C. (E) Visibility map over the full field of view. The normalized autocorrelation function used to evaluate the speckle size is shown in (F) surface plot and in (G) orthogonal sections through the center of F.
Examples of orthogonal refraction angle projections of the sample retrieved using the cross-correlation algorithm described in Zanette et al. (6) are shown in Fig. 3 A and B. An absorption projection is displayed in Fig. 3C. The edge-enhancement effect in the absorption image is particularly visible at the container-to-air interface as a pair of bright and dark lines. In the near-field regime, the edge-enhancement can be described by the Laplacian of the phase of the wavefront downstream the sample. Under rather strict assumptions on the homogeneity and a priori knowledge of the sample material, which are not satisfied in our experiment, it can be used to reconstruct the sample’s thickness (8). In this experiment, we use instead the refraction angle data to reconstruct the quantitative phase volume. Further description of this process is found in Methods.
Fig. 3.

Projections and sagittal slices of the phantom sample measured with speckle-based X-ray tomography. Refraction angle projections in the horizontal (A) and vertical (B) direction of the phantom sample. The intensity window in these images is from −3 to 3 μrad. The absorption image, which also exhibits edge enhancement, is shown in C with an intensity window from 0.4 to 1.1, and the integrated phase map is shown in D. The maximum phase shift measured in this projection is ∼300 rad for the region occupied by the PTFE sphere at the top of the image. E and F show an example of a sagittal slice through the absorption and phase volumes respectively. The measured values of δ and μ are indicated in the color bars in the figures. In E, the materials forming the phantom are given: air (A), different polymers (PMMA, PP, and PTFE), and water (H2O). The squares in F surround the regions of interest used for the calculation of refractive indices and CNRs (Table 1).
Longitudinal slices through the volumes of μ and δ from the absorption and phase projections, are shown in Fig. 3 E and F, respectively. The comparison of these results highlights the complementarity of the absorption and phase signals: whereas the PTFE sphere can be clearly seen in both volumes, the contrast provided by the container is much higher in the absorption data and the contrast from the PMMA sphere is stronger in the phase volume. This observation is confirmed by the contrast-to-noise (CNR) values in Table 1. The CNRs have been evaluated using the SDs σ and mean values of the signals of ROIs of 50 50 pixels centered in the different materials compared with a ROI in water of the same size according to the formula:
| [1] |
where the subscript m indicates the chosen material (PMMA, PP, or PTFE) and w indicates the water used as reference. The CNRs have been calculated in this way for both phase and absorption signals.
Table 1.
Refractive indices and CNRs of the materials in the sample
| Material | μ (cm−1) | δ () | CNR of μ | CNR of δ |
| PMMA | 0.77 ± 0.06 | 1.13 ± 0.02 | 2.6 | 3.5 |
| PP | 0.46 ± 0.07 | 1.05 ± 0.01 | 5.6 | 0.1 |
| PTFE | 1.84 ± 0.11 | 1.53 ± 0.02 | 6.5 | 18.9 |
| H2O | 1.01 ± 0.07 | 1.05 ± 0.02 | — | — |
The table reports the measured values of δ and μ of the materials in the sample with the corresponding uncertainties. A comparison with the tabulated values of the refractive indices for these materials is discussed in the SI Text. The phase and attenuation CNRs of the materials composing the specimen compared with water clearly illustrates the complementarity of the two image signals. The values in this table are extracted from the ROIs in Fig. 3F.
In Fig. 3E, the edge-enhancement signal already observed in the absorption projection data remains visible also in the tomographic reconstruction and highlights the boundary between the PMMA and the surrounding water, which has similar attenuation coefficient. The values of the refractive indices of the materials of the phantom calculated in the ROIs indicated in Fig. 3F are reported in Table 1. By comparison with the values reported in literature (9), our measured refractive indices vary in the interval 14.5 keV for PP (external layer) to 20.5 keV for PFTE (inner structure). These values are consistent with the average energies calculated from the detected energy spectra when considering the effect of “beam hardening” (SI Text).
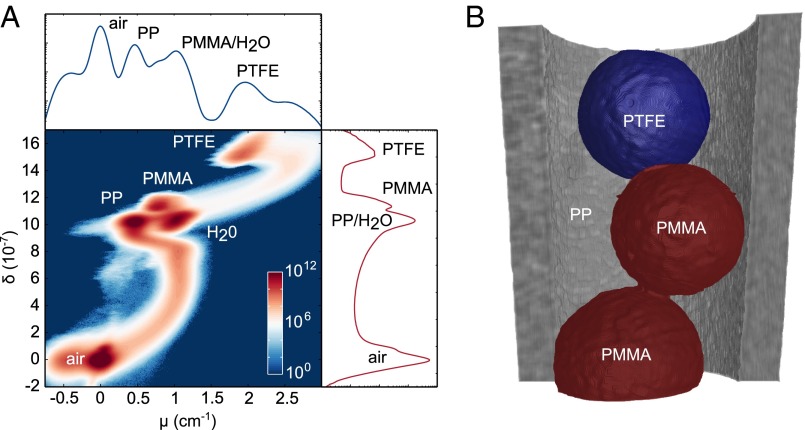
The quantitative analysis of the volume is completed using the 2D (μ vs. δ) histogram calculated from all voxels in the volumes. The 2D histogram, shown in Fig. 4A, is compared with the histogram plots of the two volumes separately (right and top of the 2D histogram). Although some peaks in the 1D histograms coincide, all of the materials composing the phantom form distinct peaks in the 2D histogram (labels in Fig. 4A).
Fig. 4.
Quantitative analysis of the sample using absorption and phase signals. (A) 2D histogram (δ vs. μ) of the entire volume, complemented by one-dimensional phase (Right) and absorption (Top) histograms generated by projecting the 2D histogram on the two orthogonal axes. The colors in the 2D histogram indicate, in logarithmic scale, the number of voxels with given values of (δ, μ) in the reconstructed volumes. The peaks are labeled with the name of the corresponding material. (B) 3D false-color rendering of the volume with segmentation based on the 2D histogram of A. The diameter of the spheres is 1.5 cm. For better visualization water is made transparent and only half of the container is rendered.
This analysis demonstrates that the distinction and quantification of all materials in the sample volume is made possible through a combination of the absorption and phase information. The 3D rendering shown in Fig. 4B was produced with a segmentation based on the 2D phase-absorption histogram.
Speckle-based multicontrast X-ray tomography is a simple, fast, and sensitive method to precisely measure the distribution of the full refractive index within the sample, in three dimensions and at the micrometer scale, with a resolution ultimately limited by the speckle size in the pattern used a reference. For a fixed experimental geometry, the speckle size on the observation plane depends only on the size of the diffuser structures. Thus, speckle-based imaging has the potential to be implemented with detectors of different pixel sizes.
To increase the spatial resolution, more sophisticated methods such as speckle scanning can be used (10). This method, however, introduces complexity in the setup and significantly increases the acquisition time. Improvements in the algorithm used to track the speckles, for example, by modeling speckle distortions and the decrease in visibility, might also be beneficial to increase image contrast and spatial resolution.
Compared with grating-based methods (11–17), some of which have been recently implemented in rapid single-shot modality, speckle-based imaging does not require a series of sophisticated and strongly absorbing optical elements. Moreover, it inherently provides the 2D differential phase information, and the use of the random diffuser does not impose limitations on the geometry or energy of the experiment.
Propagation-based methods, on the other hand, are very flexible and provide high-resolution data using only the effect of X-ray propagation from sample to detector (18), but with these methods, the phase can be quantitatively separated from the absorption signal only in very special cases (8, 19).
Because of its simplicity and potential, we believe that X-ray imaging based on near-field speckle correlation as presented here has important applications in such diverse fields as materials science and biomedicine.
Methods
Setup and Experimental Parameters.
The liquid-metal-jet source was operated at a voltage of 50 kVp and a power of 30 W with a liquid anode formed of Ga, In, and Sn. The size of the source was (h) (v) μm2. The static diffuser, a piece of sandpaper with grains of size of ∼22 μm, was placed at m from the source and upstream from the sample. The latter sat on a translation stage, for collection of reference beam images, and on a rotation stage used for tomography. The sample was positioned at = 1.5 m from the source.
The detector, located at m from the source, was a CCD camera with an effective pixel size of = 9 μm coupled through an optic plate to a 15-μm-thick 5-mg/cm2 Gadox (gadolinium oxysulfide) scintillator. The measured point spread function of the detector had a full width at half maximum of 25 μm.
With this geometry, the magnification of the near-field speckles was Mspeckles = , and the magnification of the image of the sample was . Thus, the pixel size at the sample plane was 4.7 μm.
During the tomography scan, 200 projections were collected over 180°, with 0.9° of angular spacing. The acquisition time per frame was 2 min. Two reference (flat field) images without sample in the beam but with the same exposure time were collected every 10 projections to correct for beam instabilities. A series of five dark images (without beam) were recorded, and their median was used to correct the raw data for the dark current of the detector.
Processing and Reconstruction.
First, all images have been corrected for diffuser drift using an area in the background as reference. For the processing of each sample image of the tomographic scan, the pair of reference images recorded closest in time has been averaged to be used as reference pattern. The algorithm used to obtain refraction angle and absorption data are based on cross-correlation with subpixel precision using the model described in detail by Zanette et al. (6). The window size used for these data is 30 30 pixels. The resulting refraction angle images have been combined together with a regularized integration routine that uses the residual error of the correlation algorithm to obtain the quantitative phase map (6). The phase and absorption volumes have been calculated by applying the filtered-back projection algorithm (20) to the series of phase and absorption images, respectively. The same Ram-Lak filter has been used for both signals.
As the filtered back-projection algorithm reconstructs the phase volume in the form of a stack of slices orthogonal to the rotation axis, the refraction angle projections along x could be used alone to reconstruct the quantitative phase tomogram. This approach, combined with integration in Fourier space incorporated in the filter of the back-projection algorithm, is commonly used in other phase-contrast imaging techniques such as X-ray grating interferometry (21). In the proposed speckle-tracking method, the availability of the refraction angle signal in the orthogonal y direction allows significant reduction of artifacts generated from noise in the projection data, as illustrated in SI Text.
Calibration of Refractive Index Values and Calculation of Contrast-to-Noise Ratios.
The quantity measured at the position () in the absorption projections is described, in absence of edge enhancement, by the integral of the linear attenuation coefficient
| [2] |
where is the intensity distribution impinging on the sample, and z is the direction of propagation of the X-ray beam. Thus, the tomographic reconstruction of the logarithm of the normalized absorption data, , yields the 3D distribution of μ within the specimen.
The phase shift obtained in the integrated phase map is related to the real part of the refractive index δ as
| [3] |
where λ is the wavelength of the radiation. The tomographic reconstruction from phase projections directly yields the volume data for δ. The phase is obtained as integration of the two refraction angle projections and (6). The signal in the refraction angle data are related to the geometry of the experiment and measured speckle displacements and as
| [4] |
and analogously for y. The calibration of δ and μ has been performed, for both volumes, using the air region surrounding the specimen.
SI Text
Energy Spectra and Values of Refractive Indices.
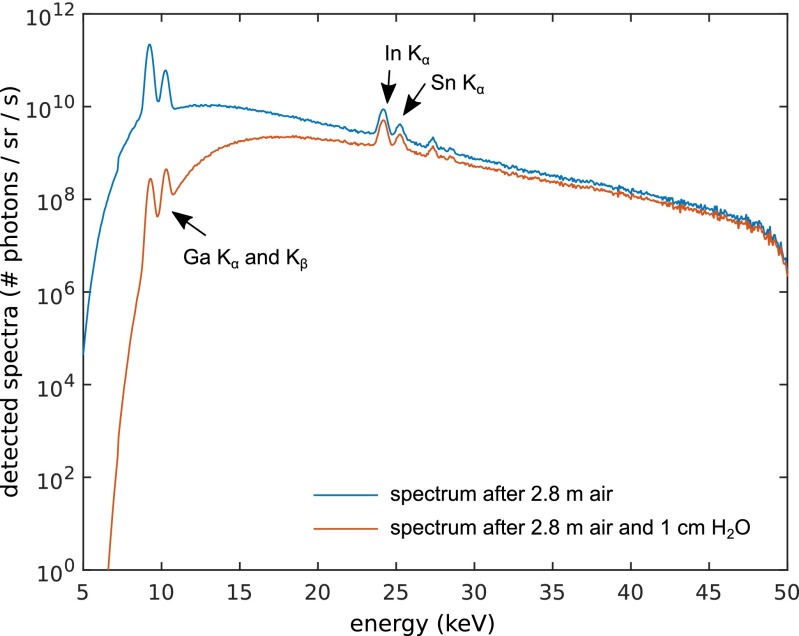
The energy spectrum produced by the liquid-metal-jet X-ray source used in this study at a distance of 2.8 m is shown in Fig. S1 with a blue line. This is the detected spectrum as it also takes into account the quantum efficiency of the detector, and its average energy is of 13.3 keV. The sample absorbs the incoming X-rays and changes the shape of the detected spectrum, causing beam hardening. The spectrum calculated by simulating the effect of the sample, i.e., by considering also propagation in 1.0 cm of H2O, is shown in red in Fig. 1. The peaks generated by the Ga lines are significantly reduced, and the mean energy is shifted to 21.8 keV.
Fig. S1.
Detected X-ray energy spectra generated by the liquid-metal-jet source without sample (blue) and simulating the hardening of the sample (red). The average X-ray energies calculated for both cases are used to validate of the refractive indices measured with our technique.
Fig. S2.
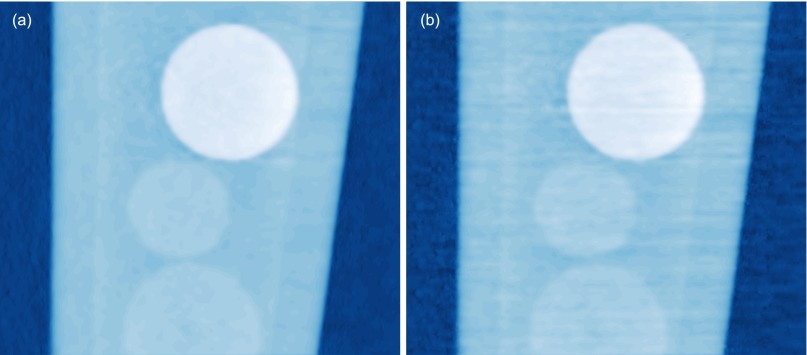
This figure compares the phase tomograms reconstructed from phase projections (A) and from differential phase projections along a single direction perpendicular to the rotation axis (B). The horizontal lines in B caused by noise and artifacts in the projection data are significantly reduced if the two-directional information is used. This comparison illustrates the advantage of speckle-based imaging compared with other techniques, such as grating-based methods, which deliver the differential phase signal along only one dimension.
The values of refractive indices reported in Table 1 can be compared with the tabulated values (22). However, it should be noted that polymers like PMMA, PFTE, and PP might vary in composition and density depending on the manufacturer, and thus their refractive indices are not defined with absolute precision. By comparison with the values from ref. 22, our measured refractive indices vary in the interval 14.5 keV for PP (external layer) to 20.5 keV for PFTE (inner structure). These values are consistent with the average energies calculated from the detected energy spectra.
Acknowledgments
We acknowledge financial support through the Deutsche Forschungsgemeinschaft (DFG) Cluster of Excellence Munich-Centre for Advanced Photonics, the DFG Gottfried Wilhelm Leibniz program, the European Research Council (FP7 and StG 240142 and 279753), the Swedish Research Council, and the Wallenberg Foundation.
Footnotes
The authors declare no conflict of interest.
This article is a PNAS Direct Submission.
This article contains supporting information online at www.pnas.org/lookup/suppl/doi:10.1073/pnas.1502828112/-/DCSupplemental.
References
- 1.Cerbino R, et al. X-ray-scattering information obtained from near-field speckle. Nat Phys. 2008;4(3):238–243. [Google Scholar]
- 2.Giglio M, Carpineti M, Vailati A. Space intensity correlations in the near field of the scattered light: A direct measurement of the density correlation function g(r) Phys Rev Lett. 2000;85(7):1416–1419. doi: 10.1103/PhysRevLett.85.1416. [DOI] [PubMed] [Google Scholar]
- 3.Alaimo MD, et al. Probing the transverse coherence of an undulator x-ray beam using brownian particles. Phys Rev Lett. 2009;103(19):194805. doi: 10.1103/PhysRevLett.103.194805. [DOI] [PubMed] [Google Scholar]
- 4.Bérujon S, Ziegler E, Cerbino R, Peverini L. Two-dimensional x-ray beam phase sensing. Phys Rev Lett. 2012;108(15):158102. doi: 10.1103/PhysRevLett.108.158102. [DOI] [PubMed] [Google Scholar]
- 5.Morgan KS, Paganin DM, Siu KKW. X-ray phase imaging with a paper analyzer. Appl Phys Lett. 2012;100(12):124102–124104. [Google Scholar]
- 6.Zanette I, et al. Speckle-based x-ray phase-contrast and dark-field imaging with a laboratory source. Phys Rev Lett. 2014;112(25):253903. doi: 10.1103/PhysRevLett.112.253903. [DOI] [PubMed] [Google Scholar]
- 7.Hemberg O, Otendal M, Hertz HM. Liquid-metal-jet anode electron-impact x-ray source. Appl Phys Lett. 2003;83(7):1483–1485. [Google Scholar]
- 8.Paganin D, Mayo SC, Gureyev TE, Miller PR, Wilkins SW. Simultaneous phase and amplitude extraction from a single defocused image of a homogeneous object. J Microsc. 2002;206(Pt 1):33–40. doi: 10.1046/j.1365-2818.2002.01010.x. [DOI] [PubMed] [Google Scholar]
- 9.Henke BL, Gullikson EM, Davis JC. X-ray interactions: Photoabsorption, scattering, transmission, and reflection at E=50-30000 eV, Z=1-92. At Data. Nucl Data Tables (NY) 1993;54(3):181–342. [Google Scholar]
- 10.Berujon S, Wang H, Sawnhey K. X-ray multimodal imaging using a random-phase object. Phys Rev A. 2012;86(6):063813–063819. [Google Scholar]
- 11.Pfeiffer F, Weitkamp T, Bunk O, David C. Phase retrieval and differential phase-contrast imaging with low-brilliance x-ray sources. Nat Phys. 2006;2(4):258–261. [Google Scholar]
- 12.Wen H, Bennett EE, Hegedus MM, Rapacchi S. Fourier X-ray scattering radiography yields bone structural information. Radiology. 2009;251(3):910–918. doi: 10.1148/radiol.2521081903. [DOI] [PMC free article] [PubMed] [Google Scholar]
- 13.Hagen CK, et al. Theory and preliminary experimental verification of quantitative edge illumination x-ray phase contrast tomography. Opt Express. 2014;22(7):7989–8000. doi: 10.1364/OE.22.007989. [DOI] [PubMed] [Google Scholar]
- 14.Ge Y, Li K, Garrett J, Chen G-H. Grating based x-ray differential phase contrast imaging without mechanical phase stepping. Opt Express. 2014;22(12):14246–14252. doi: 10.1364/OE.22.014246. [DOI] [PubMed] [Google Scholar]
- 15.Zhu P, et al. Low-dose, simple, and fast grating-based X-ray phase-contrast imaging. Proc Natl Acad Sci USA. 2010;107(31):13576–13581. doi: 10.1073/pnas.1003198107. [DOI] [PMC free article] [PubMed] [Google Scholar]
- 16.Bevins N, Zambelli J, Li K, Qi Z, Chen G-H. Multicontrast x-ray computed tomography imaging using Talbot-Lau interferometry without phase stepping. Med Phys. 2012;39(1):424–428. doi: 10.1118/1.3672163. [DOI] [PMC free article] [PubMed] [Google Scholar]
- 17.Miao H, et al. Motionless phase stepping in X-ray phase contrast imaging with a compact source. Proc Natl Acad Sci USA. 2013;110(48):19268–19272. doi: 10.1073/pnas.1311053110. [DOI] [PMC free article] [PubMed] [Google Scholar]
- 18.Wilkins SW, Gureyev TE, Gao D, Pogany A. Phase-contrast imaging using polychromatic hard X-rays. Nature. 1996;384(6607):335–337. [Google Scholar]
- 19.Burvall A, Lundström U, Takman PAC, Larsson DH, Hertz HM. Phase retrieval in X-ray phase-contrast imaging suitable for tomography. Opt Express. 2011;19(11):10359–10376. doi: 10.1364/OE.19.010359. [DOI] [PubMed] [Google Scholar]
- 20.Kak AC, Slaney M. Principles of Computerized Tomography. IEEE Press; London: 1987. [Google Scholar]
- 21.Pfeiffer F, Kottler C, Bunk O, David C. Hard x-ray phase tomography with low-brilliance sources. Phys Rev Lett. 2007;98(10):108105. doi: 10.1103/PhysRevLett.98.108105. [DOI] [PubMed] [Google Scholar]
- 22. Manion JA, et al. (2013) NIST Chemical Kinetics Database, NIST Standard Reference Database 17, Version 7.0 (Web Version), Release 1.6.8, Data version 2013.03 (National Institute of Standards and Technology, Gaithersburg, MD)


