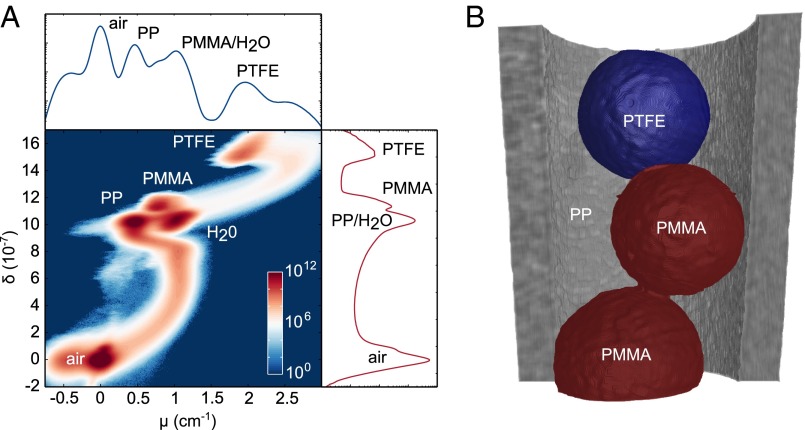
Fig. 4.
Quantitative analysis of the sample using absorption and phase signals. (A) 2D histogram (δ vs. μ) of the entire volume, complemented by one-dimensional phase (Right) and absorption (Top) histograms generated by projecting the 2D histogram on the two orthogonal axes. The colors in the 2D histogram indicate, in logarithmic scale, the number of voxels with given values of (δ, μ) in the reconstructed volumes. The peaks are labeled with the name of the corresponding material. (B) 3D false-color rendering of the volume with segmentation based on the 2D histogram of A. The diameter of the spheres is 1.5 cm. For better visualization water is made transparent and only half of the container is rendered.

