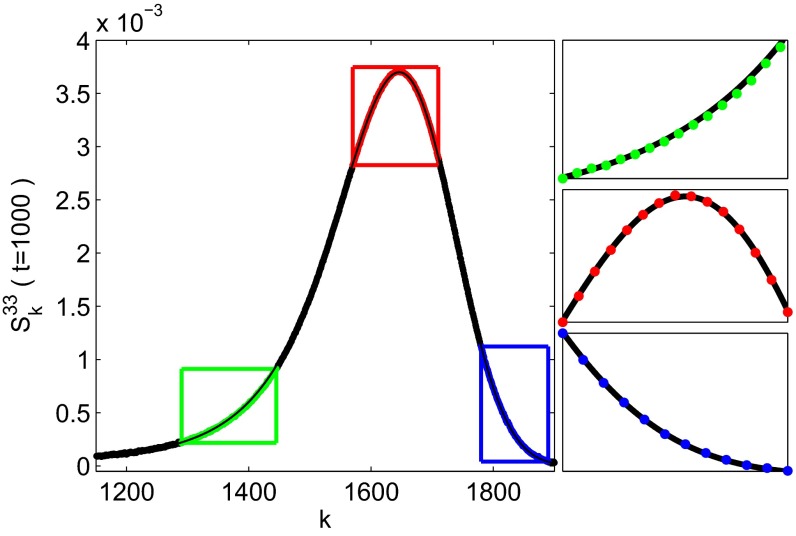
Fig. 4.
(Left) Vertical least squares fit of the numerically obtained dynamical structure function for the Fibonacci 8/5 mode (points), at time with an 8/5-stable Lévy distribution, maximal asymmetry , and theoretical center of mass (line), predicted by the mode coupling theory. The only fit parameter is the scale parameter of the Lévy stable distribution. The simulation results agree very well with the asymptotic theoretical result already for moderate times. (Right) Close-ups of the peak region and tail regions, according to a color code. Every tenth data point is plotted, to improve the visibility of the data. The statistical error with 99% confidence bound is for every data point smaller than .

