
Fig. 5.
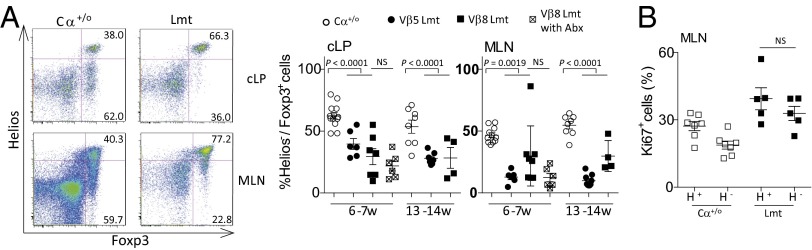
Attenuation of gut Helios− Tregs in Limited mice. (A) TCRβ+CD4+ gated cells from the cLP and MLN of Cα+/o or untreated or Abx-treated Limited mice were stained for Foxp3 and Helios. Representative cytograms for expression of Foxp3 and Helios are shown (Left). The percentage of Helios− fraction in CD4+Foxp3+ cells is plotted (Right). (B) Expression of Ki67 of MLN Helios+ (H+) or Helios− (H−) Tregs from Cα+/o or Limited mice.