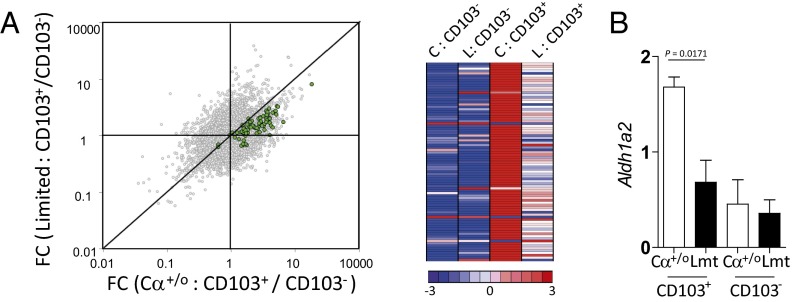
Fig. 7.
Gut migDCs from Limited mice lost the steady-state migDC signature. (A) Gene expression profile of FACS-sorted CD103+ DCs and CD103− DCs from the MLN of Cα+/o or Limited mice. A dot plot shows the comparison between fold-change (FC) of CD103+ DCs/CD103− DCs of Limited mice vs. that of Cα+/o mice (Left). Top 50 genes of the signature genes set of steady-state migDCs (22) is highlighted in green (Table S1). A heatmap shows the relative expression of migDC signature genes among CD103− DCs and CD103+ DCs from Cα+/o mice (C) or Limited mice (L) (Right). (B) Quantative RT-PCR analysis for Aldh1a2 of sorted CD103+ DCs or CD103− DCs from MLN of Cα+/o or Limited mice (n = 3 per each group).

