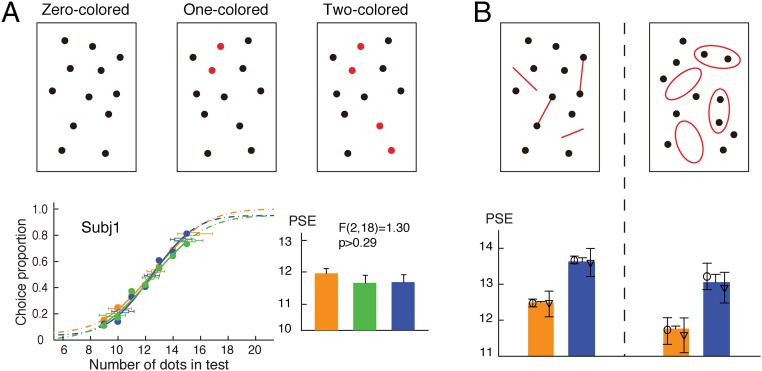
Fig. 4.
(A) Illustrations of test patterns with zero, one, and two pairs of neighboring dots colored, psychometric functions of a representative subject, and average PSEs of 10 subjects. Pairs of neighboring dots are colored red. Upper Left also illustrates a sample of the reference patterns. (B) Illustrations of test patterns using red-colored connecting lines and enclosing hollow figures. Corresponding results are shown under each test pattern. Numerical underestimation remained under both conditions. Data from individual subjects are shown with their 95% confidence intervals as well as their means and SEMs. The open symbols in B indicate individual subjects. Orange, green, and blue indicate the zero-, one-, or two-colored conditions, respectively. Subj, subject.

