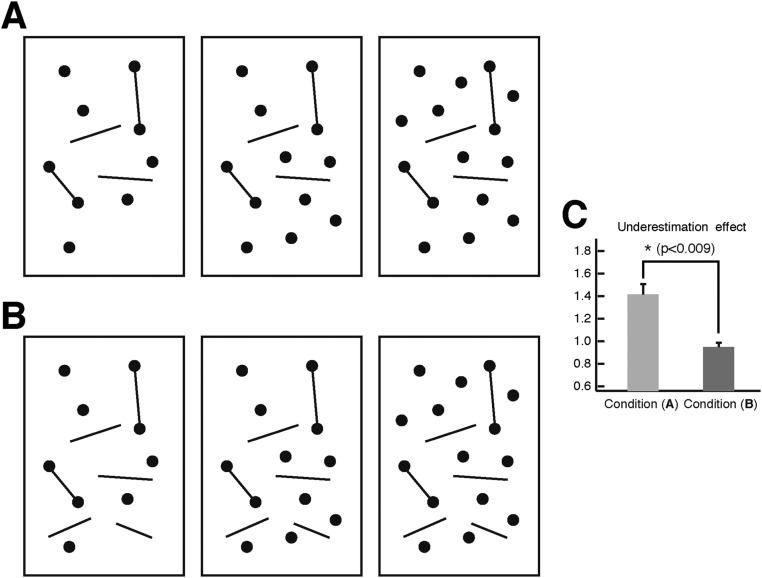
Fig. S3.
Free-hanging lines, like dots, figure into numerosity judgments. (A) Illustrations of test patterns (9–15 dots) under two-connected conditions. (B) Two free-hanging lines added to each two-connected test. (C) The underestimation effect was measured by PSE difference between two- and zero-connected conditions. Compared with the underestimation for two-connected patterns with two free-hanging lines (light gray), adding two more free-hanging lines reduced the underestimation effect (dark gray). Error bars indicate SEMs.

