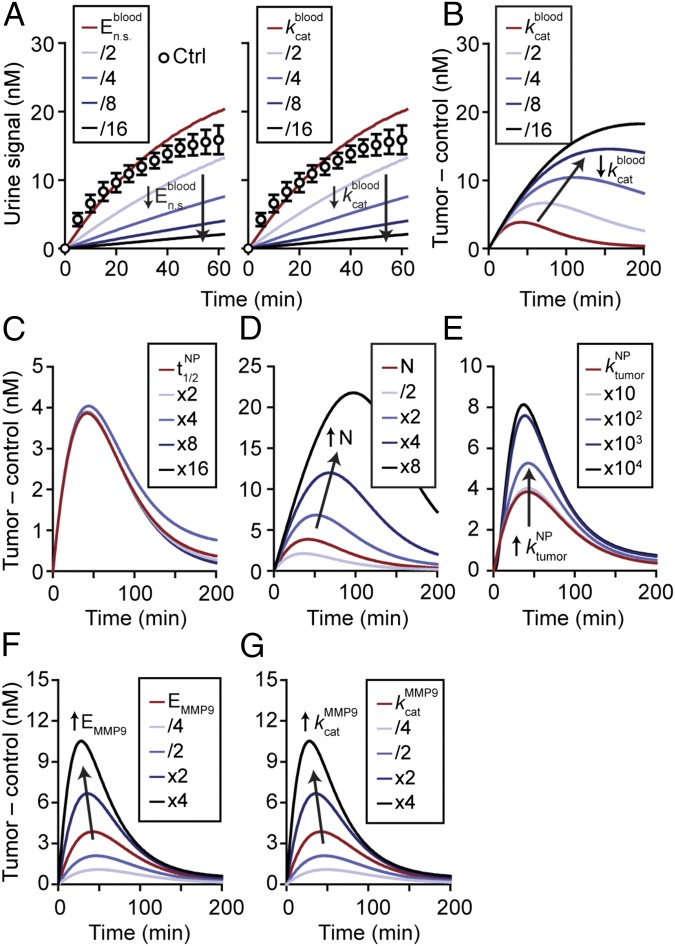
Fig. 3.
Model-predicted behavior of synthetic biomarkers. Key parameters within the mathematical model were varied to explore how they affect urine signals. (A) Urine signals decrease as background protease activities in blood (, ) are decreased (n = 3; error bars, s.d.). (B) Normalized urine signals (Tumor – control) increased as was decreased. Predicted response of the urine signal as circulation time (C), dose (D), scaffold transport into tumor (E), concentration of enzymes (F), and rate of catalysis (G) were increased. Except for dose of NPs, all increases in the parameters resulted in increased detection signals. Arrows show direction of trend.

