Fig. 4.
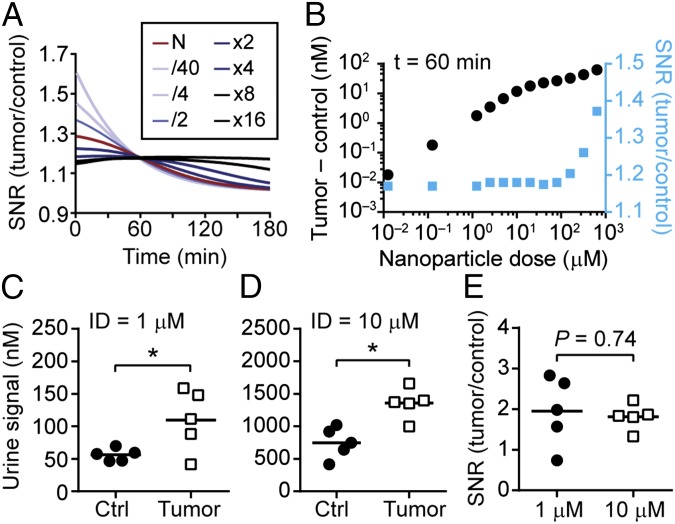
Validation of a nonintuitive model prediction. The model prediction that the SNR is invariant to NP concentrations was validated in a mouse model of CRC. (A) Kinetic curves of the SNR versus the administered dose N. At low N, SNR decays rapidly whereas at higher N, the SNR is held at a relatively steady value. (B) At an hour after NP administration, the SNR (blue) is invariant below an administered dose of 100 μM. The difference in signal between tumor and control urine samples is shown as black dots. Quantified urine signals from two cohorts of mice an hour after infusion with NPs at (C) 1 μM or (D) 10 μM (*P < 0.05, two-tailed paired t test, n = 5 mice). (E) The SNR between the two cohorts of mice was not statistically significant (P = 0.74).

