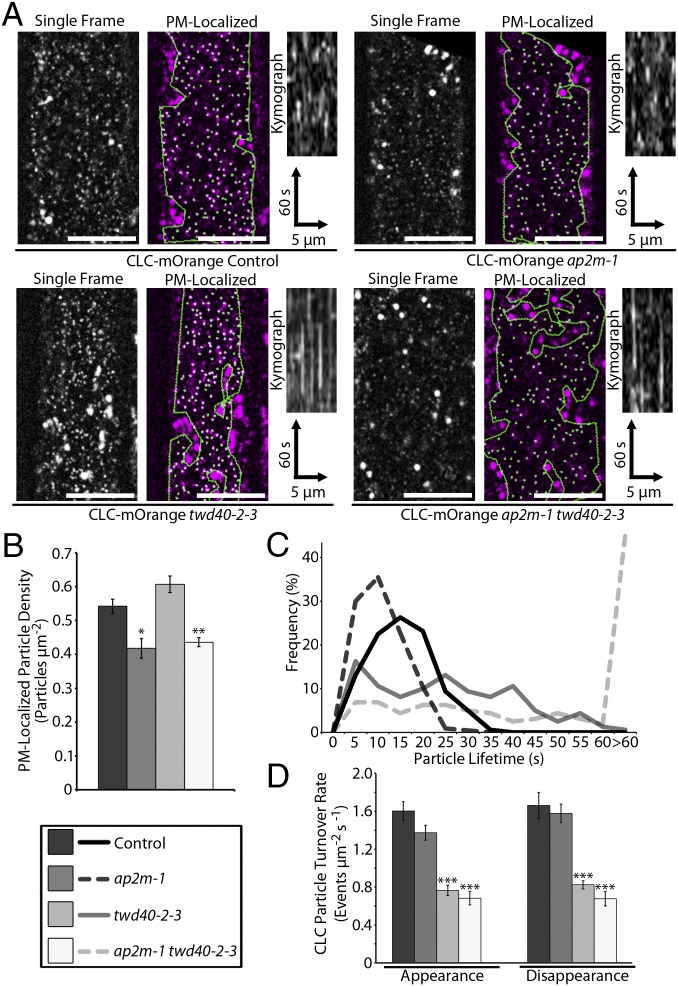
Fig. 2.
PM-localized CLC-mOrange particles are differentially affected by ap2m-1, twd40-2-3, and ap2m-1 twd40-2-3. (A) A representative image of CLC-mOrange is displayed with and without automated particle detection of PM CLC particles in control, ap2m-1, twd40-2-3, and ap2m-1 twd40-2-3 etiolated hypocotyls. (Scale bars, 10 μm.) Kymographs display particle dynamics over a 2-min time course. (B) Quantification of PM CLC particle densities. Error bars are SEM. *P < 0.01, **P < 0.001 (n = 10 for each genotype). (C) A histogram of PM CLC particle lifetimes (n = 160 particles from eight seedlings for each genotype). (D) The average CLC particle turnover rate is displayed as the rate of appearance and disappearance events per μm2 per second. Error bars are SEM. ***P < 0.0001 (n = 10 for each genotype).

