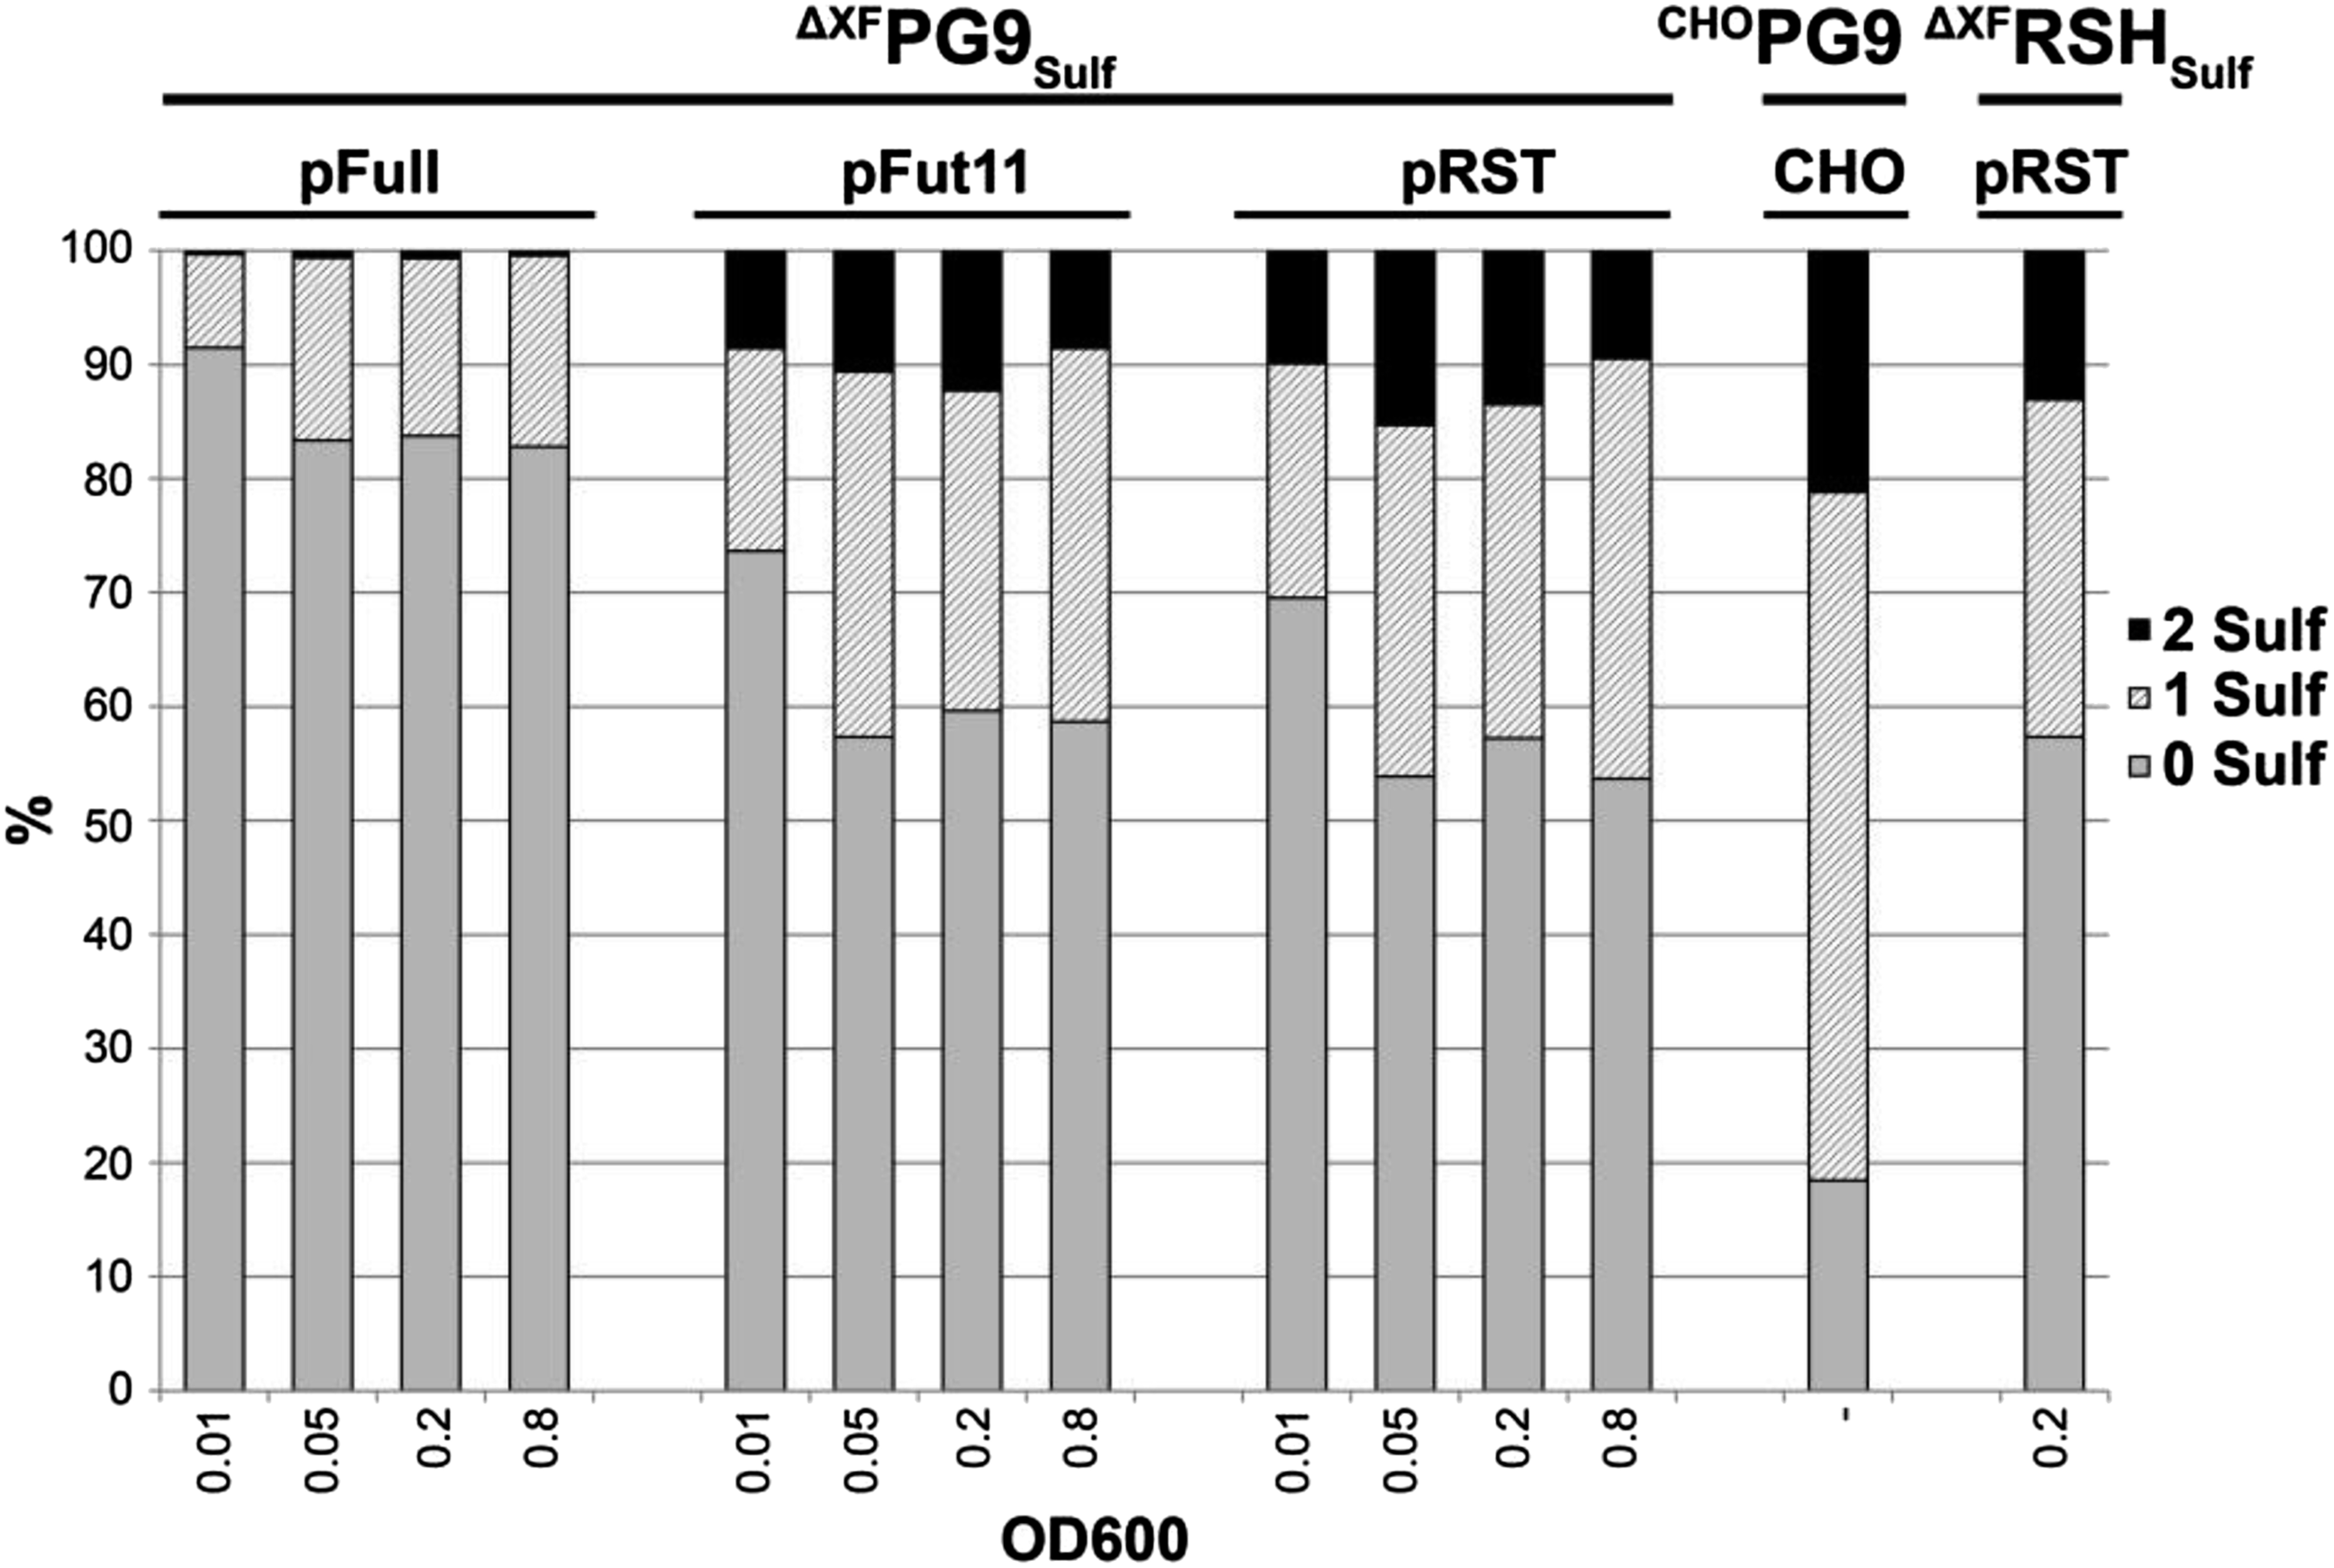
Table S1.
Tyrosine sulfation of PG9 and RSH
| mAb | TPST1 construct | OD600 | 0S (%) | 1S (%) | 2S (%) |
| ΔXFPG9Sulf | pFullhsTPST1 | 0.01 | 91.5 ± 7.0 | 8.2 ± 6.4 | 0.3 ± 0.7 |
| ΔXFPG9Sulf | pFullhsTPST1 | 0.05 | 83.4 ± 13.9 | 16 ± 13.1 | 0.6 ± 0.9 |
| ΔXFPG9Sulf | pFullhsTPST1 | 0.2 | 83.7 ± 8.8 | 15.6 ± 8.2 | 0.7 ± 0.9 |
| ΔXFPG9Sulf | pFullhsTPST1 | 0.8 | 82.8 ± 11.7 | 16.8 ± 11 | 0.4 ± 0.7 |
| ΔXFPG9Sulf | pFut11hsTPST1 | 0.01 | 73.7 ± 5.8 | 17.8 ± 3.3 | 8.6 ± 2.6 |
| ΔXFPG9Sulf | pFut11hsTPST1 | 0.05 | 57.4 ± 0.8 | 32.1 ± 2.3 | 10.6 ± 3.1 |
| ΔXFPG9Sulf | pFut11hsTPST1 | 0.2 | 59.6 ± 5.8 | 28.1 ± 5.4 | 12.3 ± 5.4 |
| ΔXFPG9Sulf | pFut11hsTPST1 | 0.8 | 58.7 ± 8.7 | 32.7 ± 10.8 | 8.6 ± 2.1 |
| ΔXFPG9Sulf | pRSThsTPST1 | 0.01 | 69.5 ± 8.9 | 20.6 ± 6.9 | 9.9 ± 2.3 |
| ΔXFPG9Sulf | pRSThsTPST1 | 0.05 | 53.9 ± 6.1 | 30.8 ± 2.3 | 15.3 ± 3.8 |
| ΔXFPG9Sulf | pRSThsTPST1 | 0.2 | 57.2 ± 10.4 | 29.3 ± 7.4 | 13.5 ± 5.1 |
| ΔXFPG9Sulf | pRSThsTPST1 | 0.8 | 53.7 ± 11.1 | 36.8 ± 11.8 | 9.5 ± 2.7 |
| ΔXFRSHSulf | pRSThsTPST1 | 0.2 | 57.4 ± 7.6 | 29.6 ± 5.2 | 13.1 ± 3.6 |
| CHOPG9 | 18.5 ± 1.5 | 60.4 ± 3.9 | 21.1 ± 5.4 |

Relative amounts of unsulfated (0S), monosulfated (1S), and disulfated (2S) PG9 and RSH when coexpressed with different hsTPST1 constructs in plants. The sulfation status of CHOPG9 is shown for comparison. Data are presented as means ± SD of two to nine analyses.
