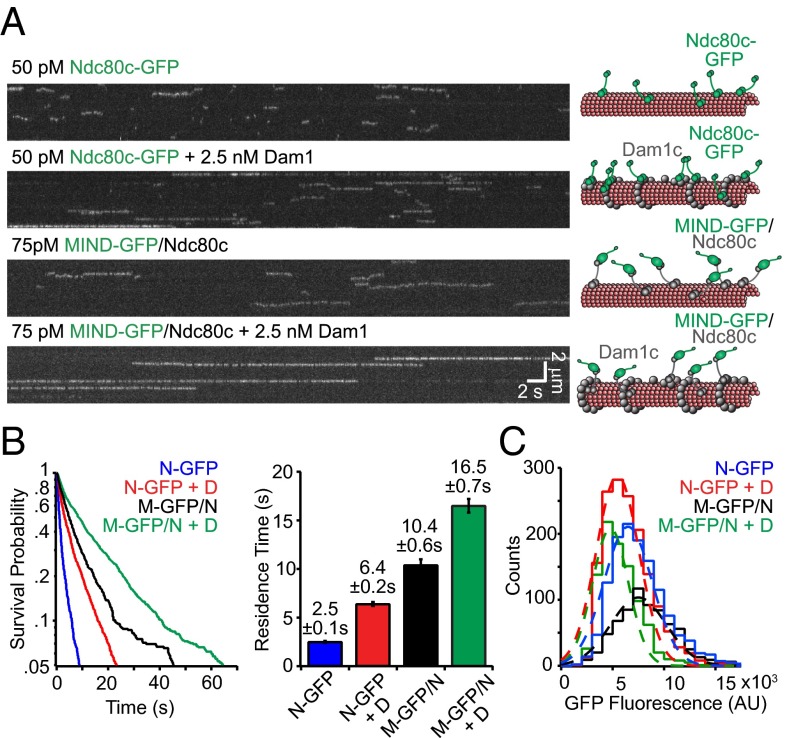
Fig. 3.
MIND and Dam1c individually and additively enhance the binding of Ndc80 complex to microtubules. (A) Representative TIRF kymographs of Ndc80c-GFP, Ndc80c-GFP plus Dam1c, MIND-GFP/Ndc80c, and MIND-GFP/Ndc80c plus Dam1c. Concentrations are noted and scale bars are indicated in white. Diagrams on right denote each GFP tagged complex (green) and untagged complex (gray) binding to microtubules (red) in kymograph on left. (B, Left) Survival probability vs. time is plotted for each complex, quantified from individual binding events. Ndc80c-GFP (N-GFP, n = 1,278), Ndc80c-GFP + Dam1c (N-GFP + D, n = 1,525), MIND-GFP/Ndc80c (M-GFP/N, n = 706), and MIND-GFP/Ndc80c + Dam1c (M-GFP/N + D, n = 924). (Right) Average residence time for each complex derived from distribution on left; error bars denote SD. (C) GFP fluorescence distribution for each GFP-tagged complex shown as histograms. Gaussian fits are shown with dotted lines and used to quantify the mean GFP fluorescence for each complex. The number of events is the same as in B. The mean fluorescence values for each complex are as follows: N-GFP = 7,000 ± 2,300 arbitrary units (AU), N-GFP + D = 6,000 ± 2,100 AU, M-GFP/N = 8,000 ± 2,700 AU, M-GFP/N + D = 5,300 ± 1,800 AU.

