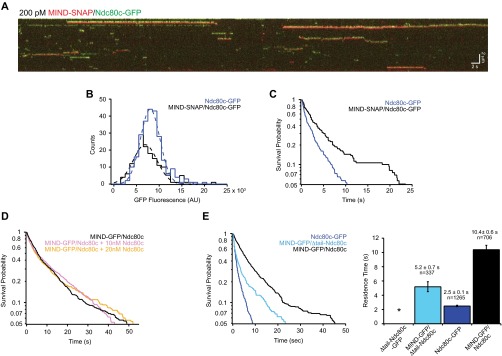
Fig. S7.

MIND does not enhance Ndc80 complex via oligomerization and does not require the Ndc80 N-terminal tail. (A) Representative two-color TIRF kymograph of individual MIND-SNAP/Ndc80c-GFP complexes binding to microtubules. MIND-SNAP is shown as red and Ndc80c-GFP shown as green. Note: Kymographs for each channel were overlaid with a slight vertical offset to visualize dually fluorescent complexes. Scale bars are shown in white. (B) GFP fluorescence distribution of individual events. Dotted lines show Gaussian fits used to determine mean GFP fluorescence for each complex. MIND-SNAP/Ndc80c-GFP, black histogram, n = 160 events, mean = 7,400 ± 2,600 AU; Ndc80-GFP, blue histogram, n = 248 events, mean = 8,500 ± 2,100 AU. Note that Ndc80c-GFP only events were measured from the same kymographs as MIND-SNAP/Ndc80c-GFP events. (C) Survival probability vs. time for Ndc80c-GFP and MIND-SNAP/Ndc80c-GFP. Ndc80c-GFP, blue line, n = 248 events, average residence time = 2.5 ± 0.2 s; MIND-SNAP/Ndc80c-GFP, black line, n = 160 events, average residence time = 6.2 ± 0.8 s. Error bars denote SD. As in B, the Ndc80c-GFP only events and MIND-SNAP/Ndc80c-GFP events were measured from the same kymographs. (D) Survival probability vs. time for 75 pM MIND-GFP/Ndc80c alone (black line), or with the addition of excess Ndc80c [10 nM (pink line) or 20 nM (gold line)] in solution. The mean residence times were as follows: MIND-GFP/Ndc80c, 12.1 ± 0.7 s, n = 604 events; MIND-GFP/Ndc80c plus 10 nM Ndc80c, 12.1± 0.9 s, n = 464 events; MIND-GFP/Ndc80c plus 20 nM Ndc80c, 11.9 ± 0.7 s, n = 610 events. (E, Left) Survival probability vs. time quantified from individual binding events for each complex noted in the legend. Note: Traces for Ndc80c-GFP and MIND-GFP/Ndc80c are repeated here (from Fig. 3B) for comparison. (Right) Average residence time with error bars denoting SD. For Δtail-Ndc80c-GFP, the * indicates no binding.
