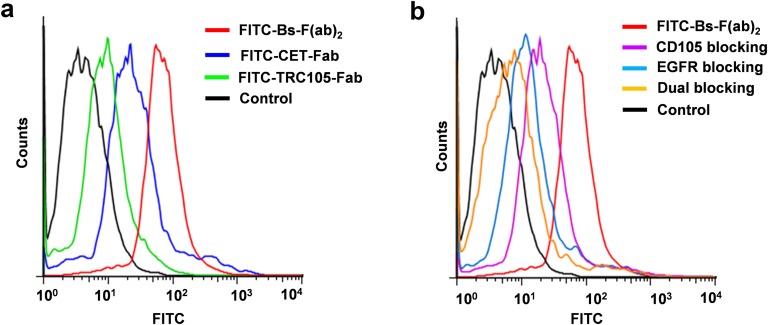
Fig. S3.
Flow cytometry data showing the enhanced binding of Bs-F(ab)2 to U87MG cells in vitro. (A) Fluorescence histogram of Bs-F(ab)2, CET-Fab, and TRC105-Fab. A clear shift to the right in the Bs-F(ab)2 curve indicates its higher binding affinity. (B) EGFR, CD105, and dual blocking experiments corroborated Bs-F(ab)2 bispecificity in vitro.

